1. Genetic Processes
2. Intelligence genes
3. What Are the Characteristics of the Genome of a High I.Q.?
4. IQ prediction based on the Genome
5. What do these genes code for?
1. Genetic Processes
Intelligence can be summarized in two parameters:
-
Quantitative: the number of alleles for high intelligence in a genome.
-
Qualitative: the nature/quality of the alleles present in a genome.
The first humans who left Africa around 100,000 years ago carried a broad spectrum of alleles for both high and low intelligence. Those who migrated to the cold climates of Europe and Asia faced the intellectual challenge of surviving in extremely harsh environments. Less intelligent individuals, carrying alleles associated with lower intelligence, were less likely to survive. The harsher the winter, the stronger the natural selection against the less intelligent.
More in detail…
The pressure of selection to improve intelligence occurred among those who had experienced the difficulty of surviving harsh winters. It was a new, more cognitively demanding environment because of the need to hunt large animals for food, as well as the need to keep children warm, which necessitated the construction of shelter and clothing. For all these reasons, cold climates exerted selection pressure for greater intelligence. Harsher winter climates exerted stronger selective pressures, leading to the evolution of higher intelligence in response. This explains the wide association between the coldness of winter, temperature, brain size, and intelligence.
Genetic processes in the evolution of IQ differences between populations:
Two genetic processes explain the evolution of differences in intelligence among populations.
The first is the difference in the frequency of alleles for high and low intelligence. Early humans carried alleles of high and low intelligence with them, but those who colonized cold environments were exposed to the cognitive requirement of survival during cold winters. Many of those with low intelligence alleles could not survive during the cold winters, and the less intelligent individuals or tribes disappeared, leaving the most intelligent survivors. This process would have reduced and possibly eliminated alleles of low intelligence, leaving a greater proportion of alleles for greater intelligence. The colder the winter, the greater the pressure of selection for the elimination of low intellectual quotients, carrying the alleles for a weak intelligence. This process explains the wide association between the colder winter temperatures and IQ and the crescendo of cranial volumes. Piffer (2015, 2018) shows that GWAS scores for intelligence were parallel to racial IQs, so races with higher IQs have a higher frequency of alleles linked to higher intelligence.
A second genetic process that has occurred is the appearance of new alleles by mutations. The general principles are that new mutant alleles for high intelligence are more likely to appear in large populations and populations under stress, ie, an environment in which these mutations constitute a selective advantage to survival.
Once a new allele mutated for greater intelligence had appeared, this conferred a selection advantage, and they spread through the group of nearly fifty to eighty individuals who made up the strength of the gatherer groups’ hunters at this stage of human evolution. It would then have spread fairly quickly because the hunter groups’ neighbors usually have alliances with groups of neighbors with whom they exchange mating partners, and it is reasonable to assume that this custom was present for several thousand years during the evolution of the races. These group alliances are known as Demes, and a new mutant allele for greater intelligence, which confers a selection advantage, would have spread quite rapidly through the demes. From time to time, mating took place between Demes, and by this means new mutant alleles for greater intelligence propagated from one Deme to another and, possibly, in the whole of a race.
References for the entire page Race differences in intelligence. An Evolutionary Analysis Richard Lynn, Washington Summit Publisher, 1st edition 2006 and 2nd edition 2015.
2. Intelligence Genes.
GWAS (Polygenic Score)
CHRM2
IGF2R
Dysbindin-1 (DTNBP1)
Fads2
Myopia Genes
ASPM
Dab 1
DUF1220
Some Others…
GWAS
A recent study (Piffer D. 2015, 2018) published in the journal Intelligence looked at all the genetic variations increasing intelligence discovered to date, highlighted by GWAS (Genome-Wide Association Study, which allows the highlighting of many different genetic variants involved in a phenotypic trait).
The study then evaluated racial differences in the frequency of these alleles and showed that they were parallel to I.Q. differences between populations. In other words, higher-IQ races have a higher frequency of alleles increasing intelligence in their genetic inheritance (table below).
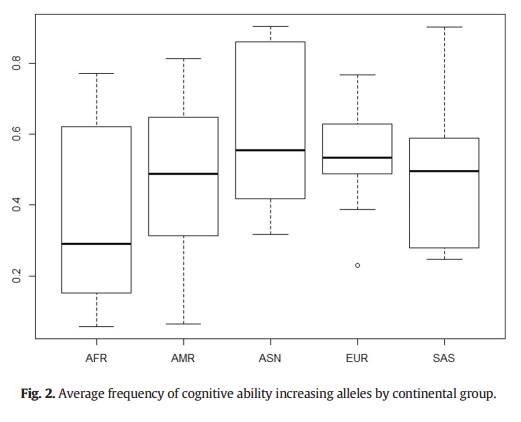
AFR is for Africans, AMR is for Native Americans, ASN is for East Asians, EUR is for Europeans, and SAS is for South Asians and North Africans.
Considering all the genetic variants increasing intelligence highlighted so far, these alleles are more common among East Asians (average IQ of 105), followed by Europeans (average IQ of 100). Native Americans (AMR, middle Q.I of 86) and South and North African Asians (SAS, middle Q.I of 84) have a lower frequency, and sub-Saharan Africans have the lowest frequency of these alleles.
The frequency of these genetic variants increasing intelligence is in agreement with the average intelligence of the populations.
The study also estimates more precisely the frequencies of these alleles for different countries. It shows the close link between National IQ and the frequency of these alleles in the population.
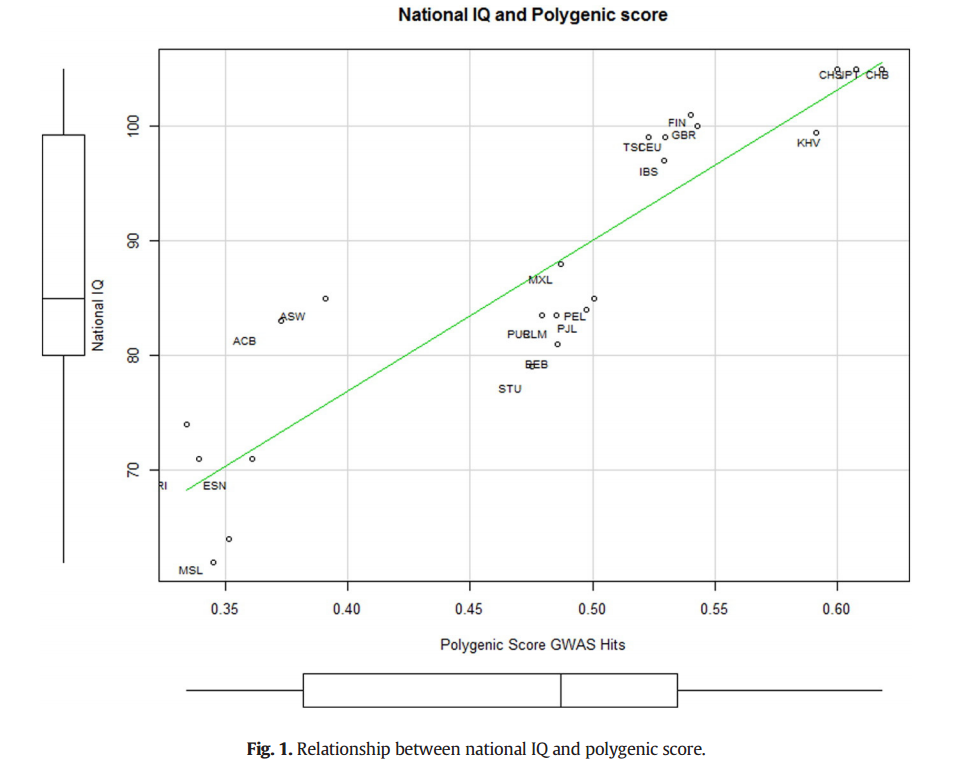
Fig. 2 and Fig. 1 above extracted from A review of intelligence GWAS hits: Their relationship to country IQ and the issue of spatial autocorrelation, Intelligence 53 (2015) 43–50.
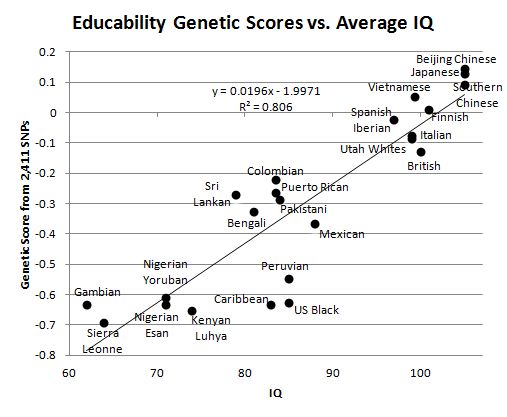
Below is a table of educability genetic scores based on over 2400 allelic variations. These scores are highly correlated with intelligence; they are even currently better intelligence estimators than purely intellectual scores, because studies have been done on larger samples (Plomin, 2018). As can be seen, these educability genetic scores are parallel to racial IQ. East Asians have the highest frequencies of favorable alleles, followed by Europeans. Africans have the lowest frequencies of these alleles.
Ashkenazi Jews have a higher polygenic score for intelligence (GWAS Polygenic Score, taking into account all alleles linked to intelligence variations to date)
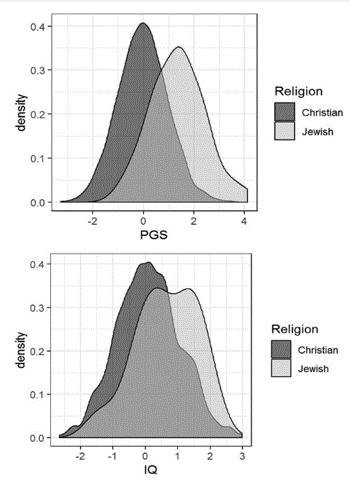
Dunkel, Kirkegaard et al. (2019) “Polygenic scores mediate the Jewish phenotypic advantage in educational attainment and cognitive ability compared with Catholics and Lutherans” Evolutionary Behavioral Sciences
CHRM2 Gene
Location: 7q31-35.
Gain of 6.89 Q.I points in individuals carrying the rs2061174 A allele in the adult population.
The CHRM2 gene encodes a GPCR receptor that mediates neuronal excitability, synaptic plasticity, and feedback regulation of acetylcholine release.
Genetic variations were studied. SNPs rs2061174 and rs324650 were most correlated with intellectual gain.
Gain 6.89 (PIQ) points for individuals carrying the rs2061174 A allele in the adult population.
In the young population (12 years old), it is the t allele of rs324650 that shows a gain of 5.3 points of Q.I
The difference between the two populations demonstrates the existence of processes of brain maturation.
-CHRM2 gene in human cognition
-Article in Nature
IGF2R Gene
Location: 6q25-27.
A particular allele (allele 5) of this gene is responsible for a gain of 4 points of Q.I.
A team led by Dr. Robert Plomin, a geneticist at the London Institute of Psychiatry, has discovered this gene, which may well affect individuals’ level of intelligence.
Allele 5 was present in 46 percent of individuals at Q.I of 160, compared to only 23 percent in children at Q.I of 100.
This variant accounts for less than 2 percent of intellectual disparities, or a difference of 4 points of Q.I.
Many genes have a positive or negative impact on IQ. Some have more positive genes than negative ones, others have positive and negative genes, leading to an average Q.I.
Dysbindin-1 (DTNBP1) Gene
Location: 6p22.3
There are 6 different alleles of this gene. Frequency differences between races would explain a third of the intellectual differences between blacks and Europeans.
Fads2
Location: 11q12-13
A gain of 7 I.Q. points in breastfed infants if the carrier of the allele.
Myopia Genes
Not yet located.
The revised data support the conclusion that axial myopia is hereditary recessive. Myopic people are excellent in terms of intelligence, with several studies in developed countries showing a gain of 7 IQ points in the general population. It also seems that people who are phenotypically non-myopic but heterozygous carriers of a myopia gene benefit from brain enhancement, probably a little smaller than what happens in homozygous myopia. It is concluded that the myopia gene is, above all, an intelligence factor.
Racial distribution: Logically, congenital myopia of genetic origin shows a frequency that follows the hierarchical order of IQ. Thus, we find the lowest rate of myopia among Africans, followed by North Africans, Amerindians, and Southeast Asians. Europeans have a higher frequency, followed by East Asians (Chinese, Korean, Japanese …) and Ashkenazi Jews, the latter showing the highest frequency of congenital myopia.
Major Intelligence Gene Tied to Myopia: A Review, by Karlsson, Jon L. – Mankind Quarterly, Vol. 49, Issue 3/4, Spring 2009
IQ and the Association with Myopia in Children
ASPM Gene
Location: 1q31.
Pathological forms of the mutated gene lead to microcephaly. A new allele appeared 6,000 years ago. It is found in large proportions among Caucasians, in medium proportions among Asians, and in a very small proportion in Africa. This allele increases intelligence and cranial capacity. Once again, we see that the emergence of such an allele was parallel to the conquest of new territories, creating a higher selective pressure.
Dab 1 Gene
Location: 1p31-p32.
It increases brain density and overall mass. It is more common among the Chinese. The current hypothesis is that this allele is the Asian counterpart of the ASPM gene found more frequently in Europeans.
DUF1220
Location: chromosome 1
Duf1220 is a genetic variation of the type “CNV” (copy number variation), namely a genetic sequence that is repeated in the genome. The number of repetitions of this structure in the genome seems to be linearly associated with intelligence, both in an inter-species evolutionary perspective (homo sapiens have the largest number of copies DUF1220, more than 260) than in an intra -species (the smarter homo sapiens have a greater number of DUF1220 in their genome).
Table below: evolutionary perspective and comparison of the number of DUF1220 by species.
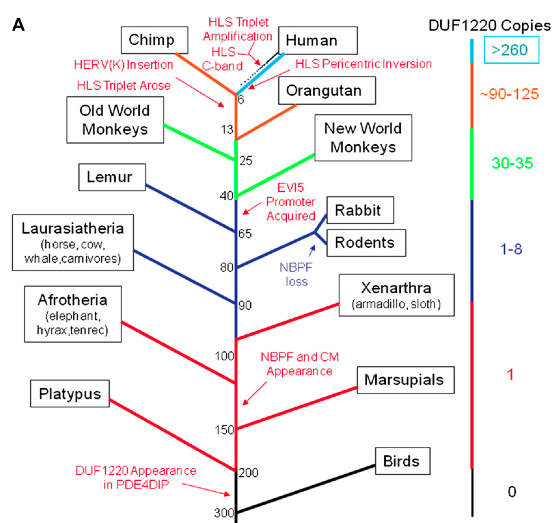
We do not know much about this genetic variation (we will certainly know much more in a few years), but it is very likely that the number of DUF1220 repetitions varies between human populations. Thus, Africans, who have on average a smaller brain, 1280 cc, and an average IQ of 80, probably have a lower number of DUF1220 repeats on their chromosome 1 than Europeans (1369 cc and an average IQ of 100). , and they probably have less repeat DUF1220 on their chromosome 1 than East Asians (1416 cc and 106 average IQ).
The future will tell us what, but Helmuth Nyborg already evokes this hypothesis.
Some other tracks …
HAR1 gene: would be involved in developing the cerebral cortex between the 2nd and 19th weeks of gestation. On the other hand, he did not seem to have a particular responsibility in forming the part of the cortex responsible for his cognitive faculties, ie, his ability to accumulate knowledge, his capacity for reflection and deduction, and so on. The part of the brain that gathers its functions is the frontal, parietal, and occipital neocortex, and the temporal lobes.
MGC8902 gene: much greater self-replication in humans than in primates and even more so in other animals. But this gene controls the synthesis of a family of proteins, DUF1220, particularly present in this part of the brain and also in neurons and their ramifications. To give an example of this hyperactivity, know that, at the same time that the gene MGC8902 reproduces 212 copies of protein DUF1220 in humans, it only synthesizes 30 to 37 copies in the chimpanzee or the macaque and only one in the rat. All this is just a working hypothesis that needs to be confirmed.
Region 2q24.1-31.1 (LOD score of 4.42) overlaps region 2q21-33, which has already shown a link with autism.
Region 6p25.3-22.3 (LOD score 3.20 for the general Q.I and 2.33 for the verbal Q.I) straddling the region
6p22.3-21.31 is involved in dyslexia.
3. What Are the Characteristics of the Genome of a High IQ?
One characteristic of the DNA of people of very high intelligence is a lower frequency of rare mutations. Conversely, schizophrenics and people with the lowest IQ would have a higher frequency of these mutations.
Individuals with very high IQs would have advantageous versions of alleles found throughout the intellectual distribution, which is in continuity with normal, while less intelligent individuals would have mutations that are not found in the normal distribution.
Intelligence is a highly genetic and polygenic characteristic. The genome of a very intelligent person is characterized by a higher density of alleles for high intelligence (myopia, more copies of DUF1220 …) and a lower density of alleles for low intelligence.
4. IQ Prediction Based on the Genome
Intelligence is a highly genetic and polygenic trait, like size. Many genes are in play, each varying the final result by only a few points (a few tenths of a point) or a few millimeters. A very intelligent individual will thus have a favorable version of most intelligence-enhancing genes. More than 1000 genes involved in intellectual variations have already been highlighted. It is possible to aggregate the effect of each gene to obtain a polygenic score divided into a Gaussian distribution.
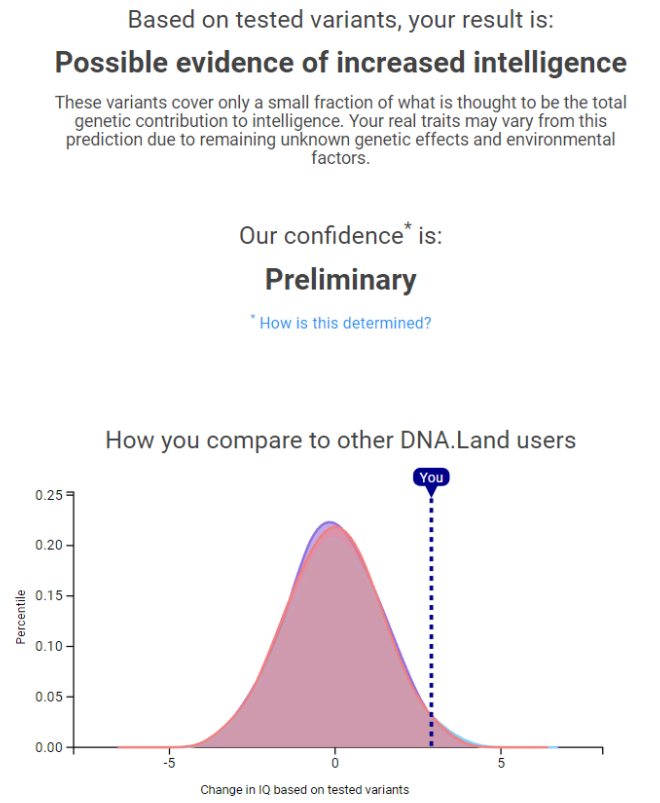
Genetic analysis is booming. Companies such as 23andMe can sequence the variable parts of your genome, and other companies like www.dna.land offer you to analyze, from the raw data available on 23andMe, the gene versions (the alleles) that you possess for the genes involved in general intelligence. From there, they can estimate your “most likely IQ”. At present, only a small part of these genes has been highlighted, so the possible estimate is extremely inaccurate.
Below is an analysis done by DNA.land from 23andMe’s raw genetic data.
The sequenced person has a favorable version, increasing the general intelligence, of most of the genes analyzed.
Below, the 16 genes considered for the analysis. They are only responsible for a small part of the total intellectual variance. The other genes are still unknown today. Also note: the frequency of these genes varies according to the race of the individuals (column 6). The highest intelligence of East Asians, Ashkenazim, or Europeans is primarily due to a higher frequency of alleles increasing intelligence in the genome of these populations.
With advances in genetics and as new genes involved in intellectual variations are detected, this estimate will become increasingly accurate, and the margin of error will shrink.
It will be possible in a few years to estimate with relative precision the intelligence of an individual on the basis of his genome. This may be very useful for preimplantation embryo selection. When a couple wants to have a child, a hundred (or even more) embryos at a very early stage of a few cells will be developed from the father’s spermatozoa and the mother’s oocytes. All these embryos will be sequenced rapidly, and the one with the highest frequency of alleles increasing intelligence will be selected and implanted in the maternal uterus. This procedure will significantly increase intelligence from generation to generation.
5. What do these genes code for?
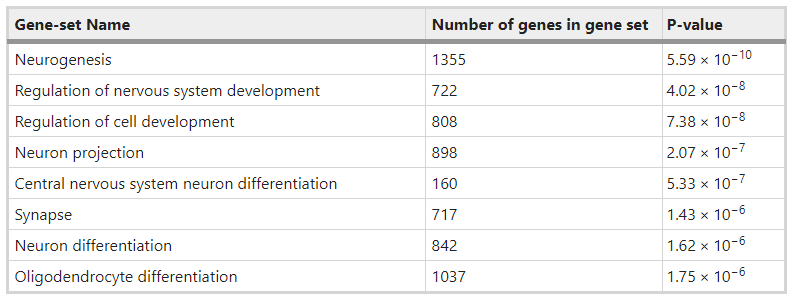
The main biological systems involved in genotypic differences in intelligence (Nature, 2019) are:
– Neurogenesis: generation of neurons from neuronal stem cells
-Genes expressed in the synapse (role in synaptic plasticity)
-Genes involved in the development of the nervous system
-Genes involved in neuronal projection and differentiation
-Genes involved in the differentiation of oligodendrocytes (myelination of the central nervous system)
Organs in which the genes associated with intelligence differences are primarily expressed (Nature, 2019). The dotted lines indicate statistical significance.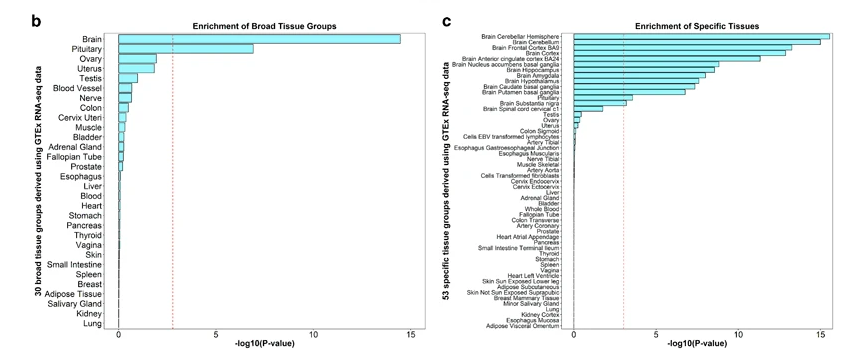
References
Plomin, R. (2018). Blueprint: How DNA makes us who we are. MIT Press.
https://mitpress.mit.edu/9780262039161/blueprint/
Zabaneh, D., Krapohl, E., Gaspar, H. A., Curtis, C. J., Lee, S. H., Patel, H., Newhouse, S., Wu, H., Simpson, M. A., Thornton, L. M., Breen, G., & Plomin, R. (2018).
A genome-wide association study for extremely high intelligence. Nature Communications, 9, Article 2090.
https://doi.org/10.1038/s41467-018-04362-x
Savage, J. E., Jansen, P. R., Stringer, S., Watanabe, K., Bryois, J., de Leeuw, C. A.,
Nagel, M., Awasthi, S., Barr, P. B., Coleman, J. R. I., Grasby, K. L., Hammerschlag, A. R., … Posthuma, D. (2018).
Genome-wide association meta-analysis in 269,867 individuals identifies new genetic and functional links to intelligence. Nature Genetics, 50(7), 912–919.
https://doi.org/10.1038/s41588-018-0152-6
Dunkel, C. S., Kirkegaard, E. O. W., & Woodley of Menie, M. A. (2019).
Polygenic scores mediate the Jewish phenotypic advantage in educational attainment and cognitive ability compared with Catholics and Lutherans. Evolutionary Behavioral Sciences, 13(4), 366–375.
https://doi.org/10.1037/ebs0000158


