Pacific Islanders
Pacific Islanders are the Natives of the many Pacific islands, the main ones being New Zealand, the island group of Micronesia, Melanesia, Polynesia, and Hawaii. In their genetic analysis, Cavalli-Sforza, Menozzi, and Piazza (1994) identify Micronesians, Polynesians, and Melanesians as a separate genetic cluster. The inhabitants of the Pacific Islands are a minor race, with only 1.5 million people. There are about 350 thousand Maori in New Zealand, 380 thousand on the Solomon Islands, and about the same number on the Fiji Islands. Their population is 170 thousand west of the island of Samoa and 100 thousand in Tonga. They are genetically very close to the Southeast Asians (Cambodia, Indonesia …) from which they separated just 6000 years ago.
1. IQ of Maori in New Zealand
2. IQ of Other Inhabitants in the Pacific Islands
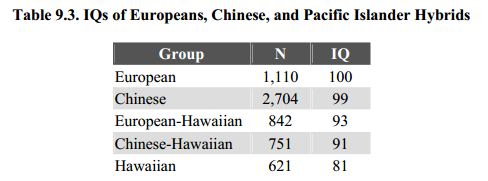
3. IQ of Pacific Islanders-Europeans hybrids and Pacific Islanders-Chinese hybrids
1. IQ of Maori in New Zealand
The median value is 85.
Table 9.1. IQs of New Zealand Maori
|
Age
|
N
|
Test
|
g
|
Reas
|
Verb
|
Vis
|
Reference
|
|
|
1
|
12-41
|
53
|
WB
|
91
|
–
|
92
|
94
|
Adcock et al., 1954
|
|
2
|
13
|
214
|
PMA
|
90
|
90
|
94
|
87
|
Walters, 1958
|
|
3
|
15
|
98
|
OTIS
|
82
|
–
|
–
|
–
|
Ausubel, 1961
|
|
4
|
11
|
18
|
WB
|
81
|
–
|
79
|
84
|
Ritchie, 1966
|
|
5
|
8-12
|
238
|
OTIS
|
85
|
–
|
–
|
–
|
Lovegrove, 1966
|
|
6
|
13-14
|
236
|
OTIS
|
81
|
–
|
–
|
–
|
Du Chareau, 1967
|
|
7
|
14
|
77
|
OTIS
|
84
|
–
|
–
|
–
|
Martin, 1969
|
|
8
|
5-7
|
80
|
Verbal
|
90
|
–
|
90
|
–
|
Clay, 1971
|
|
9
|
14
|
55
|
SPM
|
88
|
–
|
–
|
–
|
Codd, 1972
|
|
10
|
4-6
|
151
|
PIPS
|
96
|
–
|
–
|
–
|
St. George & St.
George, 1975
|
|
11
|
9
|
211
|
SPM/VC
|
91
|
91
|
91
|
–
|
Harker, 1978
|
|
12
|
8-14
|
303
|
QT
|
95
|
–
|
–
|
–
|
St. George, 1983
|
|
13
|
10-12
|
130
|
TOSCA
|
90
|
–
|
–
|
–
|
St. George &
Chapman, 1983
|
|
14
|
8-9
|
22
|
WISC-R
|
92
|
–
|
–
|
–
|
Fergusson et al.,
1991
|
|
15
|
Adults
|
103
|
VR
|
92
|
–
|
–
|
–
|
Guenole et al., 2003
|
2. IQ of other inhabitants in the Pacific Islands
|
Location
|
Age
|
N
|
Test
|
g
|
Reference
|
|
|
1
|
Hawaii
|
6-12
|
105
|
Binet
|
85
|
Porteus & Babcock,
1926
|
|
2
|
Hawaii
|
10-14
|
302
|
NV
|
90
|
Smith, 1942
|
|
3
|
Hawaii
|
10-14
|
319
|
NV
|
82
|
Smith, 1942
|
|
4
|
Mariana Islands
|
6-16
|
200
|
Arthur
|
81
|
Joseph & Murray,
1951
|
|
5
|
Marshall Islands
|
12-18
|
407
|
CF
|
84
|
Jordheim & Olsen,
1963
|
|
6
|
Samoa
|
5-7
|
80
|
Verbal
|
90
|
Clay, 1971
|
|
7
|
Papua N. Guinea
|
17-18
|
152
|
SOP
|
82
|
Waldron & Gallimore,
1973
|
|
8
|
Cook Islands
|
4-6
|
110
|
PIPS
|
89
|
St. George, 1974
|
|
9
|
Fiji
|
12
|
76
|
QT
|
84
|
Chandra, 1975
|
|
10
|
Tonga
|
8-9
|
80
|
PAT
|
86
|
Beck & St. George,
1983
|
|
11
|
Papua N. Guinea
|
7-10
|
241
|
BG
|
83
|
Robin & Shea, 1983
|
|
12
|
Hawaii-Filipinos
|
16
|
3,507
|
STAS
|
89
|
Brandon et al., 1987
|
|
13
|
New Caledonia
|
5-10
|
96
|
KB
|
85
|
Cottereau-Reiss &
Lehalle, 1988
|
|
14
|
Pacific Islands
|
9-17
|
65
|
SPM
|
88
|
Reid & Gilmore, 1989
|
3. IQ of Pacific Islanders-Europeans hybrids and Pacific Islanders-Chinese hybrids
The IQs of both groups of hybrid children are slightly above the average of the two parental races. The average IQ of European / Hawaiian couples is 90.5, while the IQ of their children is 93. Similarly, the average IQ of Chinese / Hawaiian couples is 90, whereas the IQ of children is 91.
The average IQs of the hybrids, slightly higher than the prediction based on the average of the two parental races, can be attributed to the phenomenon of “hybrid vigor” or heterosis, often present in crosses between two different populations. The same phenomenon was found in Hawaii in a study of children of Asiatic and European parents, whose IQ was 4 points higher than children of Asians and Europeans (Nagoshi and Johnson, 1986). Couples of parents had the same education and comparable socio-economic status, suggesting this is a genetic effect.


References for the entire page: Race differences in intelligence. An Evolutionary Analysis Chapter 8, Richard Lynn, Washington Summit Publisher, 1st edition 2006 et 2nd edition 2015.
