
1. National IQ in Descending Order
2. The Racial Roots of National IQ
3. Correlation between National IQ and Average Salary
4. Exponential Correlation between National IQ and Average Salary (a better fit than linear regression)
5. Other Measures Correlated to National IQ
6. National Mean IQ and Associated Society Characteristics
References
1. National IQ in Descending Order
Four values are given for the national IQ (mean IQ of the country): 2002 (from IQ and the Wealth of Nations), 2006 (from IQ and Global Inequality), 2012 (from Intelligence: A Unifying Construct for the Social Sciences), and 2023 (The Intelligence of Nations: National IQs, Update 2023). The 2023 values are the most reliable.
They vary little overall, although the average IQ in East Asia has been revised upward, especially in China (the value of 100 for China in 2002 was an underestimate). The average IQ of Western Europe has been revised slightly downward (Australia, Luxembourg, the Netherlands, Germany, Belgium), probably because the average IQ is decreasing as the proportion of Afro-Maghrebians, who have a significantly lower IQ than native Europeans, increases in these countries.
PPP-GNI per capita (2002) indicates the average income per person in 2002, and QHC is the human development index. These two parameters are highly correlated with national IQ. It already appears that national IQs are essentially determined by the proportions of the different races in the different countries (see Section 2).
| Country/Region | IQ (2023) | IQ (2012) | IQ (2006) | IQ (2002) | PPP-GNI per capita 2002 | QHC |
| Singapore | 107 | 107 | 108 | 103 | 23.730 | 60.7 |
| Hong Kong | 105 | 106 | 108 | 107 | 27.490 | 60.8 |
| China | 106 | 106 | 105 | 100 | 4.520 | 39.7 |
| North Korea | 105 | 105 | 106* | 105* | 1.000 | 38 |
| South Korea | 105 | 105 | 106 | 106 | 16.960 | 75.4 |
| Taiwan | 105 | 105 | 105 | 104 | 23.400 | 79.4 |
| Japan | 104 | 104 | 105 | 105 | 27.380 | 71.4 |
| Finland | 101 | 101 | 99 | 97 | 26.160 | 85.1 |
| Mongolia | 91 | 100 | 101* | 98* | 1.710 | 48.1 |
| Switzerland | 100 | 100 | 101 | 101 | 31.840 | 82.2 |
| Netherlands | 101 | 100 | 100 | 102 | 28.350 | 82.8 |
| Canada | 101 | 100 | 99 | 97 | 28.930 | 77.8 |
| Estonia | 101 | 100 | 99 | 97* | 11.630 | 64.5 |
| Iceland | 98 | 99 | 101 | 98* | 29.240 | 80 |
| Austria | 99 | 99 | 100 | 102 | 28.910 | 80.7 |
| United Kingdom | 100 | 99 | 100 | 100 | 26.580 | 76.7 |
| Germany | 100 | 99 | 99 | 102 | 26.980 | 78 |
| Belgium | 100 | 99 | 99 | 100 | 28.130 | 84.1 |
| New Zealand | 100 | 99 | 99 | 100 | 20.550 | 76.2 |
| Sweden | 100 | 99 | 99 | 101 | 25.820 | 82.9 |
| Australia | 99 | 99 | 98 | 98 | 27.440 | 82.8 |
| Czech Republic | 99 | 99 | 98 | 97 | 14.920 | 64.5 |
| France | 98 | 98 | 98 | 98 | 27.040 | 78.1 |
| Hungary | 98 | 98 | 98 | 99 | 13.070 | 64.1 |
| Slovakia | 98 | 98 | 96 | 96 | 12.590 | 63.2 |
| Croatia | 97 | 98 | 90 | 90 | 10.000 | 61.7 |
| United States | 98 | 97,5 | 98 | 98 | 36.120 | 86.6 |
| Norway | 97 | 97 | 100 | 98 | 36.690 | 89 |
| Andorra | 95 | 97 | 98* | N/A | 19.000 | 58.7 |
| Spain | 97 | 97 | 98 | 99 | 21.910 | 75.8 |
| Denmark | 99 | 97 | 98 | 98 | 30.600 | 85.4 |
| Russia | 97 | 97 | 97 | 96 | 8.080 | 64.5 |
| Italy | 96 | 96 | 102 | 102 | 26.170 | 78.9 |
| Poland | 97 | 96 | 99 | 99 | 10.450 | 62.7 |
| Latvia | 97 | 96 | 98* | 97* | 9.190 | 65.5 |
| Luxembourg | 97 | 95 | 100* | 101* | 53.230 | 76.4 |
| Belarus | 96 | 95 | 97* | 96* | 5.500 | 57.2 |
| Malta | 94 | 95 | 97 | 95* | 17.710 | 66.4 |
| Israel | 94 | 95 | 95 | 94 | 19.000 | 75.3 |
| Ireland | 98 | 95 | 92 | 93 | 8.500 | 52.1 |
| Ukraine | 94 | 94 | 97* | 96* | 4.800 | 61.8 |
| Portugal | 94 | 94 | 95 | 95 | 17.820 | 67 |
| Vietnam | 94 | 94 | 94* | 96* | 2.300 | 39.5 |
| Lithuania | 96 | 94 | 91 | 97* | 10.190 | 65.4 |
| Armenia | 91 | 93 | 94* | 93* | 3.230 | 50.2 |
| Argentina | 87 | 93 | 93 | 96 | 10.190 | 64.7 |
| Bulgaria | 93 | 93 | 93 | 93 | 7.030 | 59.1 |
| Greece | 93 | 93 | 92 | 92 | 18.770 | 76.1 |
| Bosnia and Herzegovina | 89 | 93 | 90* | N/A | 5.800 | 51.4 |
| Moldova | 91 | 92 | 96* | 95* | 1.600 | 46.2 |
| Malaysia | 91 | 92 | 92 | 92 | 29.570 | 78.5 |
| Cambodia | 87 | 92 | 91* | 89* | 1.970 | 28.6 |
| Cyprus | 93 | 92 | 91* | 92* | 18.650 | 67.6 |
| Uruguay | 89 | 91 | 96 | 96 | 7.710 | 64 |
| Romania | 90 | 91 | 94 | 94 | 6.490 | 53 |
| Republic of Macedonia | 85 | 90,5 | 91* | 93* | 6.420 | 54.4 |
| Thailand | 89 | 90 | 91 | 91 | 6.890 | 50.3 |
| Bermuda | 90 | 90 | 90 | N/A | 36.000 | 75.8 |
| Chile | 89 | 90 | 90 | 93* | 9.420 | 59.5 |
| Brunei | 88 | 89 | 91* | 92* | 19.210 | 50.8 |
| Turkey | 89 | 89 | 90 | 90 | 6.300 | 50.2 |
| Cook Islands | 88 | 89 | 89 | N/A | 5.000 | 45.7 |
| Laos | 83 | 89 | 89 | 89* | 1.660 | 24.9 |
| Suriname | 89 | 89 | 89 | 89 | 6.590 | 50.6 |
| Mexico | 87 | 88 | 90 | 87 | 12.500 | 52.9 |
| Ecuador | 83 | 88 | 88 | 80 | 3.340 | 47.4 |
| Samoa | 87 | 88 | 88 | 87 | 5.570 | 49.7 |
| Myanmar | 85 | 87 | 87* | 86* | 930 | 42.4 |
| Georgia | 87 | 87 | 94* | 93* | 2.270 | 51.2 |
| Bolivia | 82 | 87 | 87 | 85* | 2.390 | 49.7 |
| Iraq | 86 | 87 | 87 | 87 | 1.027 | 30.7 |
| Jordan | 87 | 87 | 84 | 87* | 4.180 | 43.4 |
| United Arab Emirates | 89 | 87 | 84* | 83* | 24.030 | 48.8 |
| Costa Rica | 87 | 86 | 89* | 91* | 8.650 | 53.7 |
| Brazil | 84 | 86 | 87 | 87 | 7.450 | 51.1 |
| Indonesia | 83 | 86 | 87 | 89 | 1.600 | 28.1 |
| Kuwait | 80 | 86 | 86 | 83* | 17.780 | 49.9 |
| Philippines | 80 | 86 | 86 | 86 | 4.450 | 51.6 |
| Tonga | 85 | 86 | 86 | 87 | 6.820 | 40.5 |
| Trinidad and Tobago | 88 | 86 | 85* | 80* | 9.000 | 52 |
| Iran | 86 | 86 | 84 | 84 | 6.690 | 40.2 |
| Bahrain | 87 | 86 | 83* | 83* | 16.190 | 49.3 |
| Kazakhstan | 87 | 85 | 94* | 93* | 5.630 | 49 |
| Azerbaijan | 85 | 85 | 87* | 87* | 3.010 | 47.2 |
| East Timor | 82 | 85 | 87* | N/A | 3.940 | 46.7 |
| Cuba | 84 | 85 | 85 | 85 | 5.259 | 46.2 |
| Fiji | 84 | 85 | 85 | 84 | 5.330 | 51.9 |
| Kiribati | 83 | 85 | 85* | 84* | 800 | 37.1 |
| New Caledonia | 85 | 85 | 85 | N/A | 21.960 | 54.9 |
| Peru | 82 | 85 | 85 | 90 | 4.880 | 49.2 |
| Libya | 83 | 85 | 83* | 84* | 7.570 | 49.3 |
| Tunisia | 81 | 85 | 83* | 84* | 6.440 | 40.6 |
| Lebanon | 83 | 85 | 82 | 86 | 4.600 | 55.8 |
| Oman | 83 | 84,5 | 83* | 83* | 13.000 | 40.6 |
| Solomon Islands | 81 | 84 | 84* | 84* | 12.660 | 44.1 |
| Seychelles | 83 | 84 | 86* | 81* | 18.232 | 60.6 |
| Federated States of Micronesia | 84 | 84 | 84* | 84* | 6.150 | 48.4 |
| Marshall Islands | 84 | 84 | 84 | 84 | 1.600 | 44.2 |
| Morocco | 75 | 84 | 84 | 85 | 2.000 | 39.9 |
| Pakistan | 83 | 84 | 84 | 81* | 3.730 | 31.7 |
| Paraguay | 82 | 84 | 84 | 85* | 6.060 | 56.6 |
| The Bahamas | 84 | 84 | 84* | 78* | 1.590 | 41.5 |
| Algeria | 80 | 84 | 83* | 84* | 5.530 | 39.9 |
| Nicaragua | 81 | 84 | 81* | 84* | 2.350 | 41.3 |
| Vanuatu | 82 | 84 | 84* | 84* | 2.850 | 31.4 |
| Puerto Rico | 82 | 83,5 | 84 | 84 | 4.590 | 45.2 |
| Venezuela | 83 | 83,5 | 84 | 88* | 5.220 | 47.4 |
| Colombia | 83 | 83 | 84 | 88 | 5.490 | 44.2 |
| Papua New Guinea | 79 | 83 | 83 | 84* | 2.180 | 38.4 |
| Egypt | 78 | 83 | 81 | 83 | 3.810 | 37.3 |
| Albania | 82 | 82 | 90* | 90* | 4.960 | 51.2 |
| Syria | 82 | 82 | 83 | 87* | 5.348 | 38.9 |
| Dominican Republic | 80 | 82 | 82 | 84* | 6.270 | 46.8 |
| India | 77 | 82 | 82 | 81 | 2.650 | 36.3 |
| Madagascar | 77 | 82 | 82 | 79* | 730 | 28.6 |
| Guyana | 79 | 81 | 87* | 84* | 3.070 | 40.2 |
| Bangladesh | 74 | 81 | 82* | 81* | 1.720 | 29.8 |
| Honduras | 81 | 81 | 81 | 84* | 2.540 | 41.9 |
| Maldives | 81 | 81 | 81* | 81* | 4.798 | 38.5 |
| Northern Mariana Islands | 81 | 81 | 81 | N/A | 12.500 | 51.3 |
| Yemen | 68 | 80,5 | 85 | 83* | 800 | 24.5 |
| Qatar | 81 | 80,1 | 78 | 78 | 19.844 | 45.6 |
| Tajikistan | 82 | 80 | 87* | 87* | 1.640 | 27.5 |
| Turkmenistan | 84 | 80 | 87* | 87* | 4.780 | 41.7 |
| Uzbekistan | 82 | 80 | 87* | 87* | 1.640 | 39.4 |
| Panama | 80 | 80 | 84* | 84* | 1.960 | 26.2 |
| Saudi Arabia | 80 | 80 | 84* | 83* | 15.800 | 63.6 |
| Barbados | 80 | 80 | 80 | 78 | 14.660 | 60.9 |
| Guatemala | 79 | 79 | 79 | 79 | 4.040 | 34.6 |
| Sri Lanka | 79 | 79 | 79 | 81* | 3.510 | 47.7 |
| Bhutan | 78 | 78 | 80* | 78* | 1.969 | 24.1 |
| El Salvador | 78 | 78 | 80* | 84* | 4.790 | 42.6 |
| Nepal | 73 | 78 | 78 | 78 | 1.370 | 26.9 |
| Sudan | 62 | 77,5 | 71 | 72 | 1.740 | 24.6 |
| Belize | 72 | 77 | 84* | 83* | 15.960 | 56.1 |
| Comoros | 75 | 77 | 77* | 79* | 1.640 | 24.6 |
| Botswana | 77 | 77 | 70* | 72* | 7.740 | 29.4 |
| Cape Verde | 73 | 76 | 76* | 78* | 4.920 | 40.5 |
| Rwanda | 70 | 76 | 70* | 70* | 1.260 | 18.5 |
| Eritrea | 74 | 75,5 | 68* | 68* | 1.040 | 21.4 |
| Kyrgyzstan | 76 | 75 | 90* | 87* | 1.560 | 48.1 |
| Afghanistan | 72 | 75 | 84* | 83* | 700 | 13.2 |
| Djibouti | 72 | 75 | 68* | 68* | 2.040 | 22 |
| Swaziland | 76 | 75 | 68* | 72* | 4.730 | 22.2 |
| Kenya | 76 | 74,5 | 72 | 72 | 1.010 | 27.3 |
| Mauritius | 88 | 74 | 89 | 81* | 10.820 | 52.2 |
| Mauritania | 69 | 74 | 76* | 73* | 1.790 | 20.5 |
| Grenada | 74 | 74 | 71* | 75* | 6.600 | 45.3 |
| Zambia | 69 | 74 | 71 | 77 | 800 | 21.8 |
| Antigua and Barbuda | 71 | 74 | 70* | 75* | 10.390 | 53.2 |
| Tanzania | 75 | 73 | 72 | 72 | 580 | 23.2 |
| Zimbabwe | 74 | 72,1 | 66 | 66 | 2.180 | 25.2 |
| Uganda | 72 | 72 | 73 | 73 | 1.360 | 25.4 |
| South Africa | 72 | 72 | 72 | 72 | 9.810 | 38.3 |
| Burundi | 72 | 72 | 69* | 70* | 630 | 15.2 |
| Somalia | 68 | 72 | 68* | 68* | 500 | 15.2 |
| Jamaica | 75 | 71 | 71 | 72 | 3.680 | 46.5 |
| Saint Vincent and the Grenadines | 70 | 71 | 71 | 75* | 5.190 | 48.4 |
| Benin | 71 | 71 | 70* | 69* | 1.060 | 20.5 |
| Côte d’Ivoire | 70 | 71 | 69* | 71* | 1.450 | 18.1 |
| Nigeria | 69 | 71 | 69 | 67 | 800 | 27.3 |
| Angola | 70 | 71 | 68* | 69* | 1.840 | 13.7 |
| Senegal | 70 | 70,5 | 66* | 64* | 1.660 | 20.7 |
| Ghana | 64 | 70 | 71 | 71 | 2.080 | 33.7 |
| Namibia | 68 | 70 | 70* | 72* | 6.880 | 31.1 |
| Togo | 68 | 70 | 70* | 69* | 1.450 | 26 |
| Niger | 66 | 70 | 69* | 67* | 800 | 13.5 |
| Burkina Faso | 70 | 70 | 68* | 66* | 1.090 | 10.7 |
| Mozambique | 72 | 70 | 64 | 72* | 990 | 18 |
| Mali | 67 | 69,5 | 69* | 68* | 840 | 13.4 |
| Guinea-Bissau | 68 | 69 | 67* | 63* | 680 | 20.3 |
| Ethiopia | 69 | 69 | 64 | 63 | 780 | 16.7 |
| Gabon | 69 | 69 | 64* | 66* | 5.530 | 32.2 |
| Equatorial Guinea | 69 | 69 | 59 | 59 | 9.100 | 30.4 |
| Liberia | 65 | 68 | 67* | 64* | 1.000 | 21.2 |
| Republic of the Congo | 66 | 68 | 65 | 73 | 630 | 17.9 |
| Democratic Republic of the Congo | 66 | 68 | 64 | 65 | 700 | 26.9 |
| Dominica | 66 | 67 | 67 | 75* | 4.960 | 48.8 |
| Haiti | 67 | 67 | 67* | 72* | 1.610 | 20.4 |
| Lesotho | 70 | 67 | 67* | 72* | 2.970 | 24.3 |
| Saint Kitts and Nevis | 71 | 67 | 67* | 75* | 10.750 | 45.5 |
| São Tomé and Príncipe | 65 | 67 | 67* | 59* | 1.317 | 37.9 |
| Guinea | 69 | 66,5 | 67 | 63 | 2.060 | 22.5 |
| Chad | 66 | 66 | 68* | 72* | 1.010 | 20.4 |
| Cameroon | 64 | 64 | 64 | 70* | 1.910 | 23.1 |
| Central African Republic | 64 | 64 | 64 | 68* | 1.170 | 19.1 |
| Sierra Leone | 62 | 64 | 64 | 64 | 500 | 13.8 |
| The Gambia | 62 | 62 | 66* | 64* | 1.540 | 21.3 |
| Saint Lucia | 62 | 62 | 62 | 75* | 4.950 | 51.1 |
| Malawi | 65 | 60 | 69* | 71* | 570 | 24.3 |
2. Racial Roots of National IQ
Table 9.8. Race differences in brain site (cc) and intelligence
| Race | IQ | Brain Size (cc) |
| East Asians | 106 | 1416 |
| Europeans | 99 | 1369 |
| Southeast Asians | 90 | 1332 |
| Pacific Islanders | 85 | 1317 |
| North Africans and Middle Easterners | 84 | 1293 |
| Africans | 71 | 1282 |
The genetic basis of intellectual differences between nations lies in the racial identity of the population. This becomes apparent when nations are categorized by race.
East Asians have a mean IQ of 105, so nations composed mainly of East Asians have a national average IQ of about 105, with some variation (105 to 108). This is true not only of nations originally populated by East Asians, but also of nations where East Asians migrated and are now the majority (for example, Singapore).
Europeans follow with an average IQ of 99. Therefore, logically, the average IQs of European nations cluster around 99 (not only in European nations but also in nations where Europeans have migrated and form a large majority, such as Australia (99), the United States (98), or Canada (99)). With the increasing number of Afro-Maghrebian populations in Europe and Hispanics in the United States, a gradual decline in intelligence and consequently a reduction in development level compared to East Asia is in progress (See Future of the World).
The lower IQ of 92 (range 90 to 94) in Southern Europe is attributable to some gene flow between South Asians (MENA) and Europeans across the Dardanelles Strait and the production of a hybrid population in the Balkans whose IQs are intermediate between those of Europeans (99) and South Asians (84). A hybrid population is also present in Turkey, where the IQ of around 90 is only slightly lower than that of the Balkans.
The South Asians and North Africans (Middle Easterners) have an average IQ of 84, and so nations composed mainly of this race have a national average IQ around 84.
Africans in sub-Saharan Africa have an average IQ of 71 and therefore predominantly African nations have a national average IQ of around 71. This applies not only to nations on the African continent, but also to other countries where Africans form a large majority, such as Haiti (with an average IQ of 71).
| Nations-Race | IQ |
| East Asian | 105 |
| China | 105 |
| Hong Kong | 108 |
| Japan | 105 |
| Singapore | 108 |
| South Korea | 106 |
| Taiwan | 105 |
| European | 99 |
| Australia | 98 |
| Austria | 100 |
| Belgium | 99 |
| Canada | 99 |
| Czech Republic | 98 |
| Denmark | 98 |
| Estonia | 99 |
| Finland | 99 |
| France | 98 |
| Germany | 99 |
| Hungary | 98 |
| Iceland | 98 |
| Ireland | 92 |
| Italy | 102 |
| Lithuania | 91 |
| Malta | 97 |
| Netherlands | 100 |
| New Zeeland | 99 |
| Norway | 100 |
| Poland | 99 |
| Portugal | 95 |
| Russia | 97 |
| Slovakia | 96 |
| Slovenia | 96 |
| Spain | 98 |
| Sweden | 99 |
| Nations | IQ |
| Switzerland | 101 |
| United Kingdom | 100 |
| United States | 98 |
| European-South-Asian | 92 |
| Bulgaria | 93 |
| Croatia | 90 |
| Greece | 92 |
| Israel | 95 |
| Turkey | 90 |
| Romania | 94 |
| Serbia | 89 |
| Southeast Asian | 90 |
| Indonesia | 87 |
| Laos | 88 |
| Malaysia | 92 |
| Philippines | 86 |
| Thailand | 91 |
| Vietnam | 94 |
| Pacific Islanders | 85 |
| Cook Islands | 89 |
| Fiji | 85 |
| Mariana Islands | 81 |
| Marshall Islands | 84 |
| New Caledonia | 85 |
| Papua New Guinea | 83 |
| Tonga | 86 |
| Western Samoa | 88 |
| South Asia/N. Africa | 84 |
| Egypt | 81 |
| India | 82 |
| Nations | IQ |
| Iran | 84 |
| Iraq | 87 |
| Jordan | 84 |
| Kuwait | 86 |
| Lebanon | 82 |
| Mauritius | 89 |
| Morocco | 84 |
| Nepal | 78 |
| Pakistan | 84 |
| Qatar | 78 |
| Sri Lanka | 79 |
| Syria | 83 |
| Yemen | 85 |
| S-Saharan African | 67 |
| Cameroon | 64 |
| Cent. African Republic | 64 |
| Congo-Brazzaville | 64 |
| Congo-Zaire | 65 |
| Equatorial Guinea | 59 |
| Ethiopia | 64 |
| Ghana | 71 |
| Guinea | 67 |
| Kenya | 72 |
| Mozambique | 64 |
| Nigeria | 69 |
| Sierra Leone | 64 |
| South Africa | 72 |
| Sudan | 71 |
| Swaziland | 72 |
| Tanzania | 72 |
| Uganda | 73 |
| Zambia | 71 |
| Zimbabwe | 66 |
In nations populated by hybrid populations like Latin America, the mean IQ is predictable from the proportion of the different races.
Table 9.7. National IQs in Latin America and the Caribbean predicted from the racial composition of the populations
| Nations | MeasuredIQ | PredictedIQ | Racial Composition |
| Argentina | 93 | 97 | 85% European, 15% Amerindian & Mestizo |
| Barbados | 80 | 71 | 80% African, 16% Mulatto, 4% European |
| Bermuda | 90 | 85 | 61 % African & Mulatto, 37% European |
| Bolivia | 87 | 88 | 42% Amerindian, 31% Mestizo, 15% European |
| Brazil | 87 | 90 | 53% European, 3% Amerindian, 12%Mestizo, 11 % African, 22% Mulatto |
| Chile | 90 | 92 | 92% Mestizo & European, 7% Amerindian |
| Colombia | 84 | 89 | 1% Amerindian, 58% Mestizo,20% European, 4% African, 14% Mulatto, 3% African-Amerindian |
| Cuba | 85 | 92 | 12% African, 22% Mulatto, 66% European |
| Dominica | 67 | 68 | 90% African, 6% Mulatto, 4% Amerindian |
| Dominican Republic | 82 | 84 | 11% African, 73% Mulatto, 16% European |
| Ecuador | 88 | 87 | 40% Amerindian, 40% Mestizo,5% European, 5% African |
| Guatemala | 79 | 85 | 55% Amerindian, 42% Mestizo, 3% European |
| Honduras | 81 | 90 | 90% Mestizo, 7% Amerindian |
| Jamaica | 71 | 71 | 76% African, 15% Mulatto, 3% European, 3% East Indian |
| Mexico | 88 | 88 | 30% Amerindian, 60% Mestizo, 9% European |
| Paraguay | 84 | 91 | 3% Amerindian, 90% Mestizo, 7% European |
| Puerto Rico | 84 | 93 | 76% European, 24% African & Mulatto |
| St. Lucia | 62 | 75 | 90% African, 6% Mulatto, 3% East Indian |
| St. Vincent | 71 | 73 | 65% African, 23% mixed and other, 6% East Indian, 2% Amerindian, 4% European |
| Suriname | 89 | 83 | 10% African, 35% Mulatto, 3% Amerindian,33% East Indian, 16% SE Asian |
| Uruguay | 96 | 96 | 8% Mestizo, 86% European, 6% African |
| Venezuela | 84 | 85 | 67% Mestizo, 21% European, 10% African, 2% Amerindian |
3. Average Salary predicted by National IQ, Linear Regression (Lynn and Vanhanen, 2002)
| NATIONAL IQ (Lynn and Vanhanen, 2002). |
| Correlation with economic success 0.757
About 75% of the economic variance between countries is explained by the average IQ of the population. Three factors reduce the strength of this correlation (which would otherwise be even higher): 1. The degree of economic freedom: countries that have lived (or still live) under communism are, of course, much poorer than the others
|
| Pays | Q.I moyen | GDP | fitted GDP | GDP/FGDP |
| Hong Kong | 107 | 20 763 | 19 817 | 1,0477368 |
| Korea, South | 106 | 13 478 | 19 298 | 0,6984143 |
| Japan | 105 | 23 257 | 18 779 | 1,2384579 |
| Taiwan | 104 | 13 000 | 18 260 | 0,7119387 |
| Singapore | 103 | 24 210 | 17 740 | 1,3647125 |
| Austria | 102 | 23 166 | 17 221 | 1,345218 |
| Germany | 102 | 22 169 | 17 221 | 1,2873236 |
| Italy | 102 | 20 585 | 17 221 | 1,1953429 |
| Netherlands | 102 | 22 176 | 17 221 | 1,2877301 |
| Sweden | 101 | 20 659 | 16 702 | 1,2369177 |
| Switzerland | 101 | 25 512 | 16 702 | 1,5274817 |
| Belgium | 100 | 23 223 | 16 183 | 1,4350244 |
| China | 100 | 3 105 | 16 183 | 0,191868 |
| NewZealand | 100 | 17 288 | 16 183 | 1,0682815 |
| U. Kingdom | 100 | 20 336 | 16 183 | 1,2566273 |
| Hungary | 99 | 10 232 | 15 664 | 0,6532176 |
| Poland | 99 | 7 619 | 15 664 | 0,4864019 |
| Australia | 98 | 22 452 | 15 145 | 1,4824695 |
| Denmark | 98 | 24 218 | 15 145 | 1,5990756 |
| France | 98 | 21 175 | 15 145 | 1,3981512 |
| Norway | 98 | 26 342 | 15 145 | 1,7393199 |
| United States | 98 | 29 605 | 15 145 | 1,9547706 |
| Canada | 97 | 23 582 | 14 626 | 1,6123342 |
| Czech Republic | 97 | 12 362 | 14 626 | 0,8452072 |
| Finland | 97 | 20 847 | 14 626 | 1,4253384 |
| Spain | 97 | 16 212 | 14 626 | 1,108437 |
| Argentina | 96 | 12 013 | 14 107 | 0,8515631 |
| Russia | 96 | 6 460 | 14 107 | 0,4579287 |
| Slovakia | 96 | 9 699 | 14 107 | 0,687531 |
| Uruguay | 96 | 8 623 | 14 107 | 0,6112568 |
| Portugal | 95 | 14 701 | 13 589 | 1,0818309 |
| Slovenia | 95 | 14 293 | 13 588 | 1,051884 |
| Israel | 94 | 17 301 | 13 069 | 1,3238197 |
| Romania | 94 | 5 648 | 13 069 | 0,4321677 |
| Bulgaria | 93 | 4 809 | 12 550 | 0,3831873 |
| Ireland | 93 | 21 482 | 12 550 | 1,7117131 |
| Greece | 92 | 13 943 | 12 031 | 1,1589228 |
| Malaysia | 92 | 8 137 | 12 031 | 0,6763361 |
| Thailand | 91 | 5 456 | 11 512 | 0,4739402 |
| Croatia | 90 | 6 749 | 10 993 | 0,6139361 |
| Peru | 90 | 4 282 | 10 993 | 0,3895206 |
| Turkey | 90 | 6 422 | 10 993 | 0,5841899 |
| Colombia | 89 | 6 006 | 10 474 | 0,5734199 |
| Indonesia | 89 | 2 651 | 10 474 | 0,2531029 |
| Suriname | 89 | 5 161 | 10 474 | 0,4927439 |
| Brazil | 87 | 6 625 | 9 436 | 0,7020983 |
| Iraq | 87 | 3 197 | 9 436 | 0,3388088 |
| Mexico | 87 | 7 704 | 9 436 | 0,8164476 |
| Samoa (Western) | 87 | 3 832 | 9 436 | 0,4061043 |
| Tonga | 87 | 3 000 | 9 436 | 0,3179313 |
| Lebanon | 86 | 4 326 | 8 917 | 0,4851407 |
| Philippines | 86 | 3 555 | 8 917 | 0,3986767 |
| Cuba | 85 | 3 967 | 8 398 | 0,4723744 |
| Morocco | 85 | 3 305 | 8 398 | 0,3935461 |
| Fiji | 84 | 4 231 | 7 879 | 0,5369971 |
| Iran | 84 | 5 121 | 7 879 | 0,6499556 |
| Marshall Islands | 84 | 3 000 | 7 879 | 0,380759 |
| Puerto Rico | 84 | 8 000 | 7 879 | 1,0153573 |
| Egypt | 83 | 3 041 | 7 360 | 0,4131793 |
| India | 81 | 2 077 | 6 322 | 0,3285353 |
| Ecuador | 80 | 3 003 | 5 803 | 0,517491 |
| Guatemala | 79 | 3 505 | 5 284 | 0,6633232 |
| Barbados | 78 | 12 001 | 4 765 | 2,5185729 |
| Nepal | 78 | 1 157 | 4 765 | 0,2428122 |
| Qatar | 78 | 20 987 | 4 765 | 4,4044071 |
| Zambia | 77 | 719 | 4 246 | 0,1693358 |
| Congo (Brazz) | 73 | 995 | 2 170 | 0,4585253 |
| Uganda | 73 | 1 074 | 2 170 | 0,4949309 |
| Jamaica | 72 | 3 389 | 1 651 | 2,0526953 |
| Kenya | 72 | 980 | 1 651 | 0,5935796 |
| South Africa | 72 | 8 488 | 1 651 | 5,1411266 |
| Sudan | 72 | 1 394 | 1 651 | 0,8443368 |
| Tanzania | 72 | 480 | 1 651 | 0,2907329 |
| Ghana | 71 | 1 735 | 1 132 | 1,5326855 |
| Nigeria | 67 | 795 | – 944 | -0,842161 |
| Guinea | 66 | 1 782 | – 1 463 | -1,218045 |
| Zimbabwe | 66 | 2 669 | – 1 463 | -1,824334 |
| Congo (Zaire) | 65 | 822 | – 1 982 | -0,414733 |
| Sierra Leone | 64 | 458 | – 2 501 | -0,183127 |
| Ethiopia | 63 | 574 | – 3 020 | -190,0662 |
| Equatorial Guinea | 59 | 1 817 | – 5 096 | -0,356554 |
4. Exponential Correlation between National IQ and Average Salary (better relation than the linear regression)
In a 2006 study (“Exponential correlation of IQ and the wealth of nations,” Intelligence, 34, pp. 291–295), E. Dickerson shows that an exponential function describes the relationship between national IQ and GDP per capita (average salary) more accurately than a linear one.
An IQ gain of 10 points translates into a doubling of the national average salary.
A gain of 5 IQ points multiplies the average salary by 1.45.


Example: Cameroon has an average IQ of 70 and a salary of $ 1474.
Ecuador has an average IQ of 80 and an average salary of $ 3003 (about double)
Turkey has an average IQ of 90 and an average salary of $ 6422 (about double)
Hong Kong’s average IQ is 107, almost 20 points higher than Turkey’s, and its salary is $20,763, almost 2×2 = 4 times the average Turkish salary.
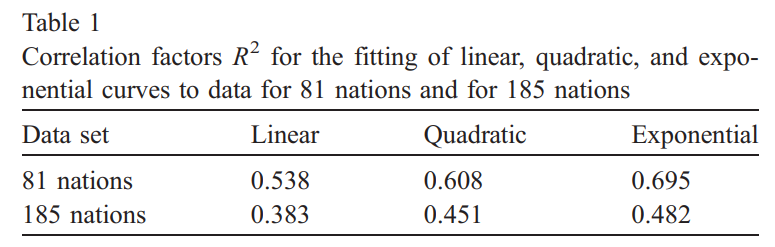
5. Other Measures Correlated to National IQ
QHC: quality of human conditions
| All countries | Total (192 countries) |
|
| QHC | 0.725 | |
| PPP GNI per capita 2002 | 0.342 | |
| Adult literacy rate 2002 | 0.655 | |
| Tertiary enrollment ratio | 0.699 | |
| Life expectancy at birth 2002 | 0.690 | |
| Index of Democratization 2002 | 0.322 | |
| Excluding the smallest countries | Total (160 countries) |
|
| QHC | 0.839 | |
| PPP GNI per capita 2002 | 0.649 | |
| Adult literacy rate 2002 | 0.733 | |
| Tertiary enrollment ratio | 0.780 | |
| Life expectancy at birth 2002 | 0.817 | |
| Index of Democratization 2002 | 0.584 | |
|
|
Latitudes and temperatures
| Correlation | Latitude | Temperature |
| Degrees latitude | 1 | -0.885 |
| Annual mean temperature | -0.885 | 1 |
| National IQ | 0.677 | -0.632 |
| QHC | 0.659 | -0.562 |
| PPP GNI per capita 2002 | 0.528 | -0.407 |
| Adult literacy rate 2002 | 0.482 | -0.467 |
| Tertiary enrollment ratio | 0.718 | -0.649 |
| Life expectancy at birth 2002 | 0.505 | -0.379 |
| Index of Democratization 2002 | 0.512 | -0.460 |
Human Development Index (2009) by national average IQ
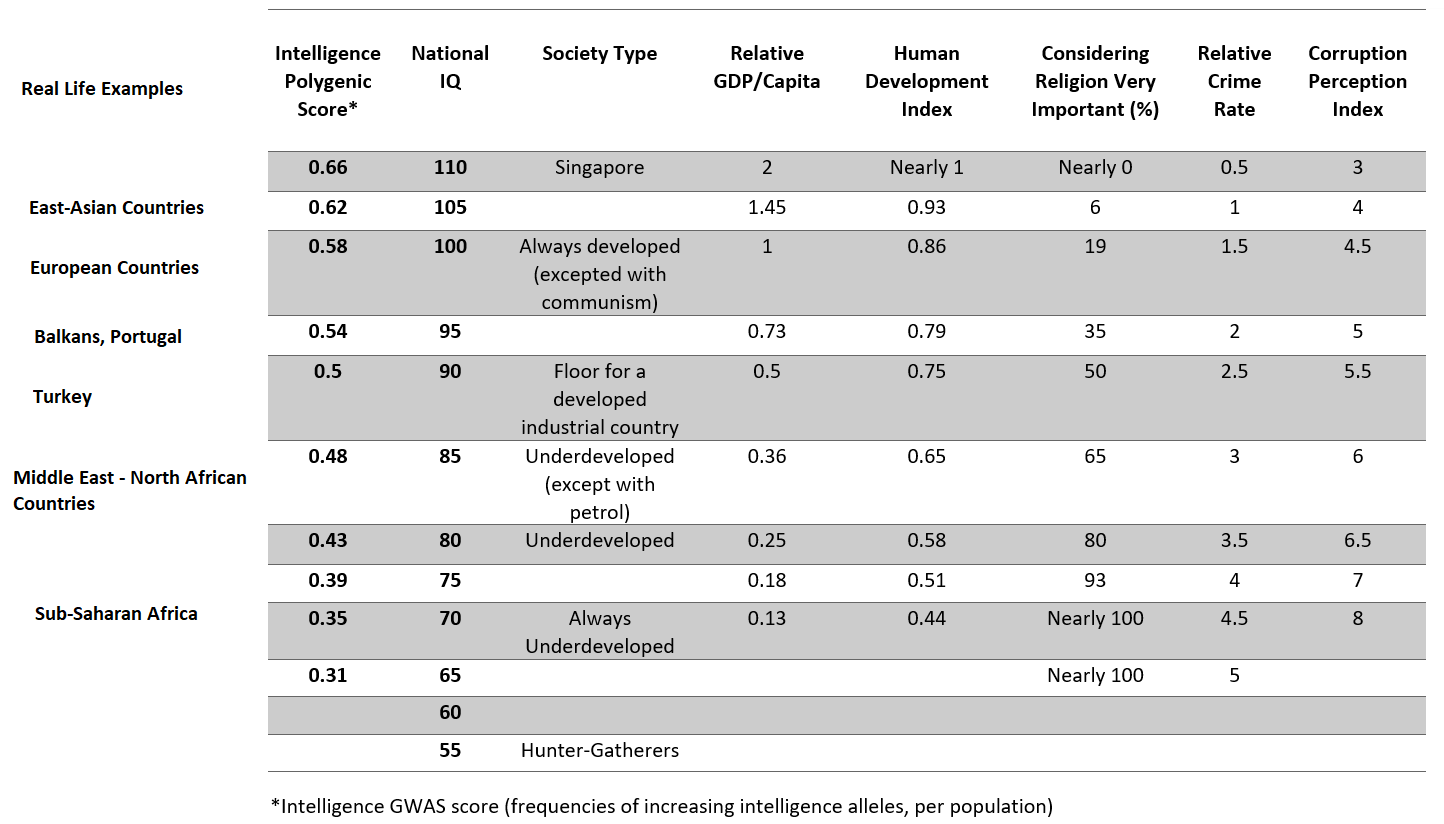
6. National Mean IQ and Associated Society
References
Dickerson, E. (2006). Exponential correlation of IQ and the wealth of nations. Intelligence, 34(3), 291–295.
Hafer, R. W. (2016). Cross-country evidence on the link between IQ and financial development. Intelligence, 55, 7–13.
Lynn, R., & Vanhanen, T. (2002). IQ and the Wealth of Nations. Westport, CT: Praeger.
Lynn, R., & Vanhanen, T. (2006). IQ and Global Inequality. Augusta, GA: Washington Summit Publishers.
Lynn, R., & Vanhanen, T. (2012). Intelligence: A Unifying Factor for the Social Sciences. London: Ulster Institute for Social Research.