I.Q Validity: Biological and Social IQ Correlations
IQ is a very good measure of intelligence—efficiency of the central nervous system—and its validity is corroborated in many ways. Here is a summary.
1.1 Head Size (+0.2)
1.2 Brain Size (+0.45)
1.3 Myopia (+0,25) et Hyperopia (Negative Correlation)
1.4 Brain Electrochemical Activity
1.5 Brain Glucose Metabolic Rate
1.6 Peripheral Nerve Conduction Volicity
1.7 Cranial Nerve Conduction Velocity
1.8 Simple Reaction Time
1.9 Cerebral pH
1.10 Finesse of the Auditory Spectrum (Ability to Distinguish Nearer Frequency Sounds, Proportional to IQ).
1.11 Finesse of the visual spectrum (Finer Ability to Distinguish Nearer Color Frequencies, Proportional to IQ)
1.12 Visual and Auditory Inspection Time (Measuring the Speed of Processing Sensory Information)
1.13 Erythrocyte Sedimentation Rate
1.14 Baseline Pupil Size (+0,35)
1.15 Telomeres Length
2. Social IQ Correlates
2.1 National/Racial IQs Predict Success in Math and Science
2.2 IQ Predicts Salary
2.3 IQ Predicts Education Level
2.4 IQ Predicts Socioeconomic Status
2.5 IQ Predicts Trainability
2.6 IQ Predicts Job Proficiency
2.7 IQ and Violent Behavior
2.8 National/Racial IQ Predict PISA Scores
2.9 IQ at 13 Predicts of Many Subsequent Achievements
2.10 National IQ, Predictive of GDP/Capita from 1500 to 2000 (See “National I.Q and Economy“)
2.11 National IQ, Predictive of Life Expectancy (See “National I.Q and Economy“)
2.12 Nation IQ, Highly Predictive of Index of Human Development (See “National I.Q and Economy“)
1. Biological IQ Correaltions
1.1 Head Size
Head size is an imperfect estimate of brain size. The correlation between IQ and head size is +0.2.
1.2 Brain Size
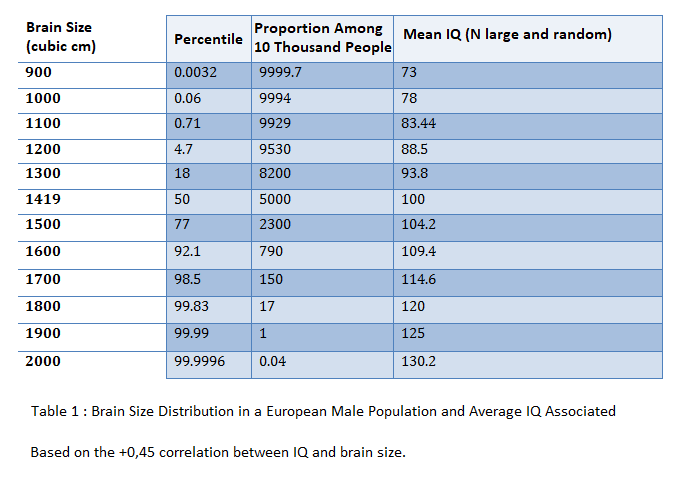
Brain size is correlated +0.45 with IQ. The brain size distribution is, like general intelligence (g), Gaussian (bell curve, figure 1 below).
A +0.45 correlation between general intelligence (= IQ) and brain size means that:
1. An increase of 1 SD in brain size (about 120 grams in mass) increases IQ by an average of 0.45 SD (7 IQ points).
2. IQs of 115 (1SD above average) have an average brain size 0.45 SD above average (about 55 grams more in mass).
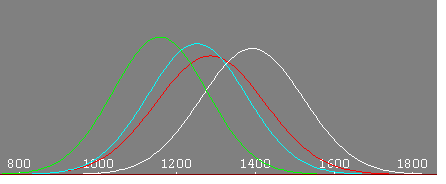
Figure 1: Cranial capacity in African-Americans (red) and Europeans (white).
This correlation is not limited to homo sapiens: mice with bigger brains are smarter and find their way more quickly in a labyrinth.
University students, whose average IQ is significantly higher than the national average, have a bigger brain (on average).
Among university students, those finishing with distinction have a bigger brain, and those finishing with great distinction have a bigger brain than those finishing with distinction. This is simply predictable by the intelligence-brain size positive correlation.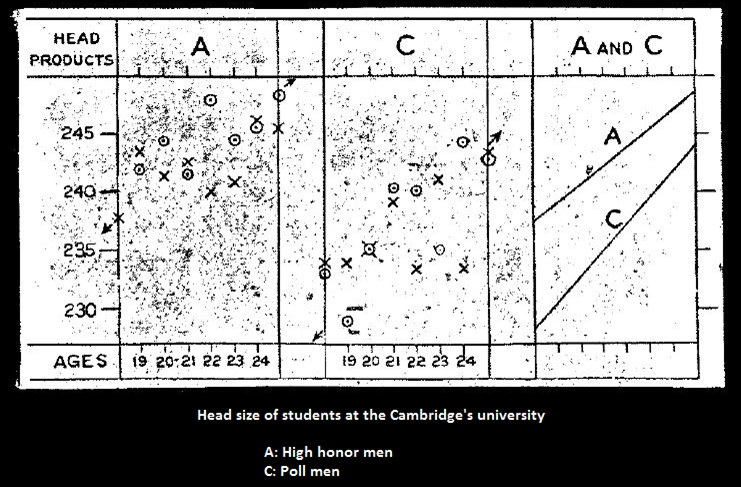
Figure 2: Cranial Capacity of Cambridge Students Aged 19 to 24, by Grade.
General Population < University Students < Distinction < Grande Distinction
Some cranial capacities of famous geniuses …
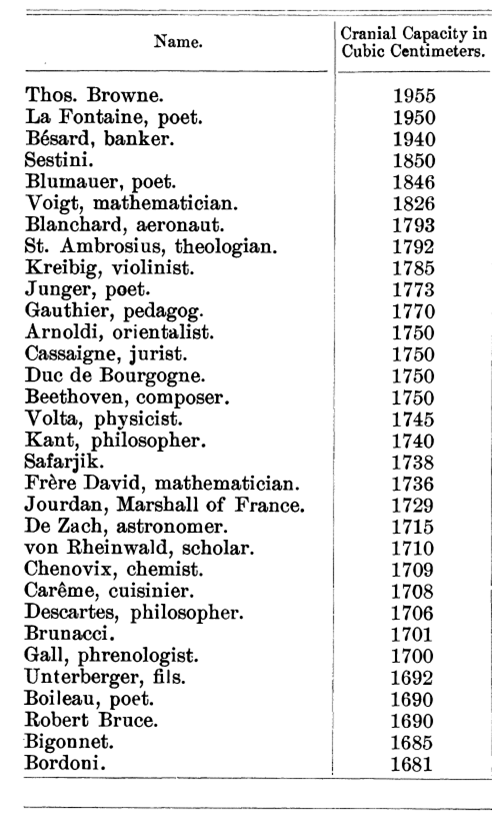
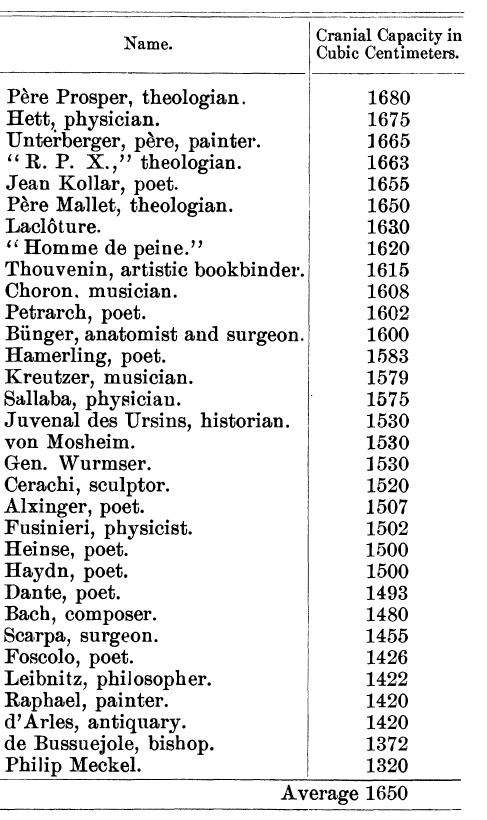
It should be noted that exceptionally intelligent individuals can be found with below-average brain size; the correlation is not 1 (the French writer Anatole France, for example, had a brain of less than 1kg, and the composer Smetana also had a below-average brain size).
How to understand a +0.45 correlation between general intelligence and brain size?
Imagine a safe filled with jewelry and bank notes of 5-10-20-50-100-200-500 euros. In the blind, you take with the help of a small shovel of say 1200ml full content from this chest. You repeat the operation 10 times. With the help of a larger 1400ml shovel, you blindly perform 10 shots in the safe.
What do you notice?
1. On average, the value of an intake of 1400ml is greater than that of 1200ml.
2. This is not true in all cases: a 1200 ml take may be very valuable, simply because it is very dense in 500 notes and jewels, for example. Conversely, a catch of 1400ml can be of little value because more dense in notes of 5 and 10 euros.
Brain size distribution in a European male population and associated mean IQ.
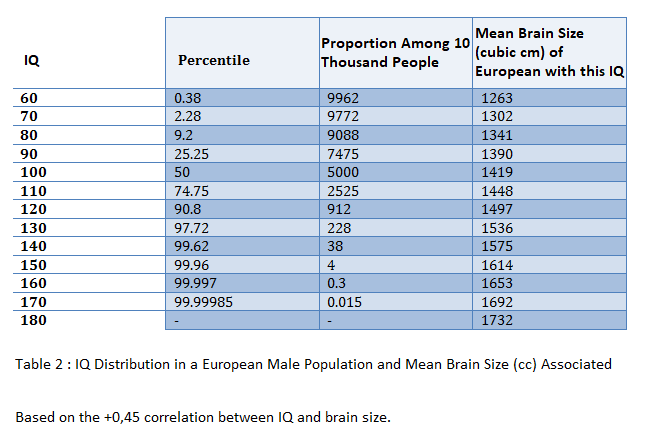
Mean IQ distribution in a European male population and associated mean brain size
1.3 Myopia (+0,25) et Hyperopia (Negative Correlation)
Myopes have an IQ of about 7.5 points above the average. Myopia is homozygously recessive. The myopia genes seem to be on chromosome 11. The eyes are extensions of the brain. It seems that the myopia genes modulate both brain size and eye size. Myopic people have a brain and eyes bigger than average. This is the characteristic of myopia: The eyes are too big so that the picture is formed at the front of the retina, which must be corrected by biconcave glasses.
Heterozygote carriers of a single gene of myopia are not myopics and do not wear glasses, but they have some intellectual gain, of lesser amplitude than the homozygous myopia.
Conversely, hyperopia (eyes too small) is correlated negatively with intelligence.
→ Positive genetic correlation between intelligence and myopia
→ Negative genetic correlation between intelligence and hyperopia

https://blog.human-intelligence.org/q-i-moyen-des-myopes-emmetropes-et-hypermetropes/
Deary I. et al. (2018) “What genome-wide association studies reveal about the association between intelligence and physical health, illness, and mortality”.
Sorjonen K. et al. (2017) “Réfractive state, intelligence, education, and Lord’s paradox” Intelligence, Volume 61, pp. 115–119.
Karlsonn J.L. (2009) “Major Intelligence Gene Tied to Myopia: A Review”.
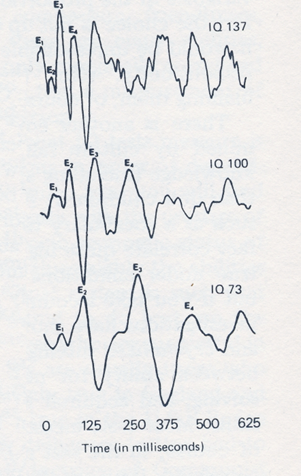
1.4 Brain Electrochemical Activity
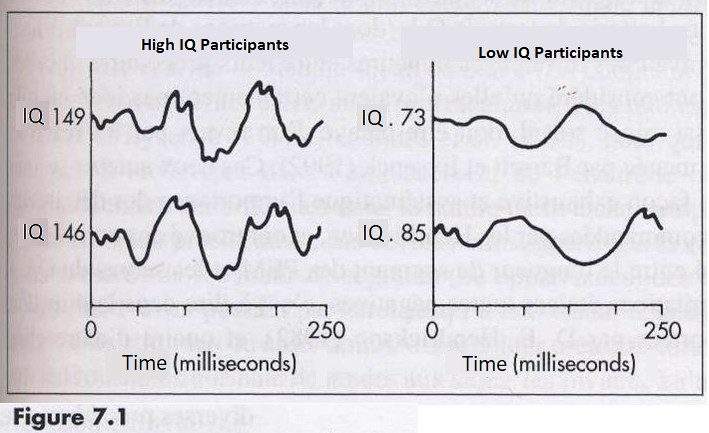
-with the complexity of the waves at the EEG.
-with the alpha waves frequency.
Evoked potentials were recorded with EEG. The score used is the length of the first 4 brain waves E1 to E4 (figure below). This score is smaller in bright individuals and higher in less intelligent individuals.
In other words, the information transmission is faster in bright people and less in less intelligent individuals.
1.5 Brain Glucose Metabolic Rate
-> The main brain energy source is glucose.
-> For the same cognitive task, high IQ brains consume less glucose while low IQ brains consume more glucose.
Correlation of -0.7 to -0.8 between IQ and GMR (glucose metabolic rate)
-> For the same task, high IQ brains operate at a lower glucose regime while lower IQ brains arrive more quickly at saturation.
-> Higher IQ brains are more effective.
-> Analogy with a computer:
-a weak computer arrives more quickly to saturation of its processor.
-a more powerful computer is more efficient; it processes identical information using less of its system resources.
If we now subjectively calibrate a difficulty level, for example, to succeed at a cognitive task in 75 percent of cases, what will be defined as a difficult task?
With a success rate of 75%:
-Low IQ brains can perform a less complicated task, for example retain 6 digits.
-Higher IQ brains manage to perform a more complicated task, for example holding 7 digits.
In this case, IQ is correlated positively with GMR, mean that higher IQ brains can reach higher glucose metabolic rates, if needed.
Analogy with a computer:
-If a less powerfull computer runs at 80 percent of its capacity (threshold subjectively fixed as “difficult task”), it will accomplish a smaller task, achieve a lower processor speed and consume less.
-When a more powerfull computer runs at 80 percent of its capacity (subjectively referred to as a “difficult task”), it will accomplish more difficult tasks because it is able to achieve higher processor speed by consuming more.
-> for the same objective task, higher IQ brains consume less -> more effective brains.
-> for a task judged subjectively difficult, higher IQs perform more complex tasks, are able to reach a higher processing power by metabolizing more glucose (higher GMR) -> They are able to climb higher in their GMR -> more powerful brains
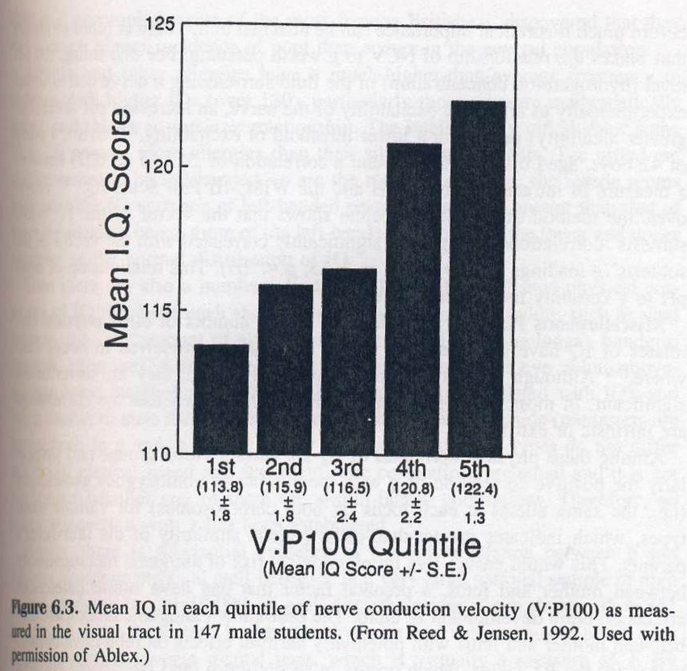
1.6 et 1.7 Vitesse de conduction nerveuse (nerfs périphériques et nerfs crâniens)
Correlation of +0.4 between nerve conduction velocity and IQ.
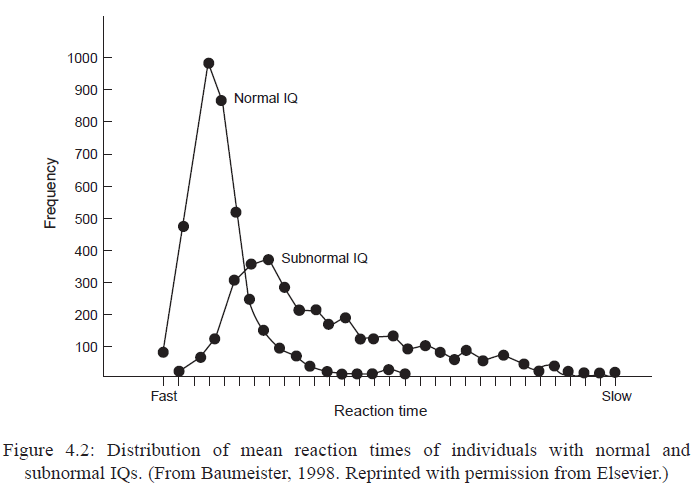
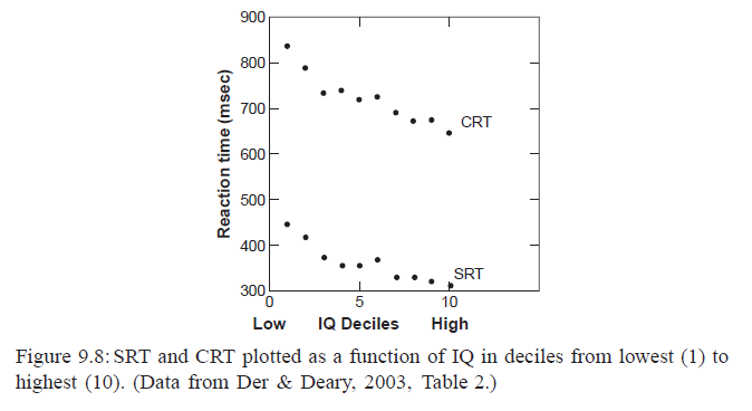
1.8 Simple Reaction Time (SRT)
Reaction time is correlated with IQ, as both are signs of efficiency of the central nervous system.
Reaction times are measured as follows: Someone is placed in front of a small lamp that will light. Whenever he does, he simply presses the button in front of him as quickly as possible.
It is a sign of the efficiency of the nervous system since it is in a way a basic treatment of informations. Reaction times are measured in milliseconds.
Below, simple reaction times: green IQ < or = 130, purple IQ > or = 160.
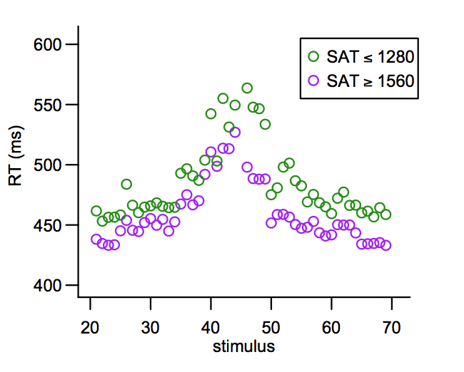
Below: SRT for normal IQs and IQs below average.
Lower IQs have longer reaction times with greater variance (SDRT), since from time to time they produce much slower reaction times, which increases the mean and the variance.
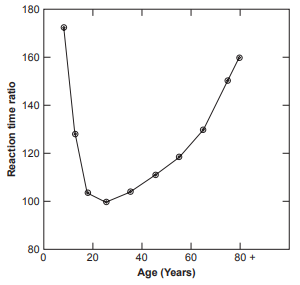
Simple reaction times are faster between 20 and 30 years, in agreement with the highest intelligence and the highest brain size of this period of life (see FAQ intelligence).
1.9 Brain pH, a Biochemical IQ Correlate
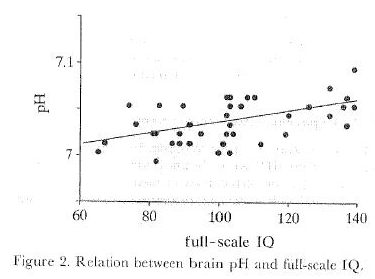
-> Higher pH increases conduction velocity
-> pH variations also modulate the activity of many receptors and neurotransmitters
1.10 Finesse of the Auditive Spectrum (Finer Ability to Distinguish Nearer Sounds Frequencies, Proportional to IQ)
Surprising as it may seem, there is a positive correlation between IQ and fineness of the auditory spectrum, ie the ability to distinguish closer sound tones. These tests are performed as follows: sounds of different frequencies are emitted. Gradually, we bring the sounds closer by asking the subjects to designate the higher sound. Correlation between g and the fineness of the auditory spectrum underscores the ubiquity of g in all brain processes. It allows us to understand why all major composers, for example, were individuals with an IQ of around 165 (Cox).
1.11 Finesse of the Visual Spectrum (Finer Ability to Distinguish Nearer Sounds Frequencies, Proportional to IQ)
There is also a positive correlation between IQ and the fineness of the visual spectrum, ie the ability to distinguish closer colors. These tests are performed as follows: different color frequencies are presented. Gradually, we bring the colors together by asking the subjects to designate the two colors and the border between them.
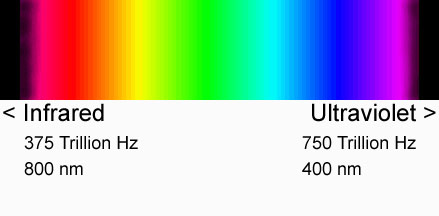
The higher the IQ, the more individuals are able to distinguish nearby color tones.
1.12 Auditory and Visual Inspection Time (measuring the speed of processing sensory information)
“Inspection time” measures the speed of processing visual or auditory information. These measures are correlated +0.7 with IQ.
In this type of test, two bars of unequal length appear on the screen for a short period of time (in milliseconds). We then ask the participant which bar was the longest: the one on the right or the one on the left.
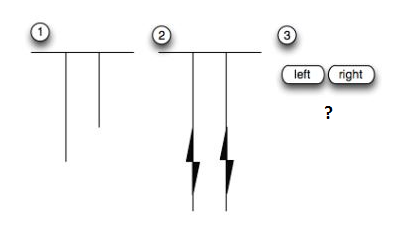
Higher IQs process visual or auditory information more quickly. They have smaller inspection times.
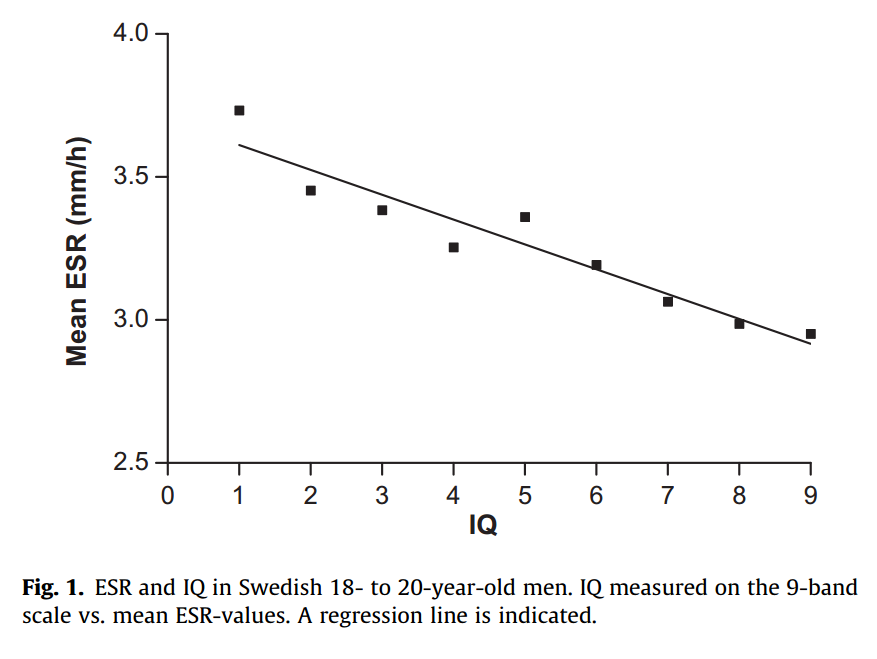
1.13 Erythrocyte Sedimentation Rate
ESR (erythrocyte sedimentation rate) is an indirect measure of inflammation level. Several studies have already shown an inverse association between level of inflammation and intelligence. A high ESR is also a prognostic factor for cardiovascular disorders later in life.
IQ is categorized by decile (decile 1 = mean IQ of 81, decile 2 = IQ of 87, decile 3 = IQ of 92, decile 4 = IQ of 96, decile 5 = IQ of 100, decile 6 = IQ of 104, decile 7 = I.Q of 108, decile 8 = IQ of 113, decile 9 = IQ of 119)
1.14 Baseline Pupil Size
Smarter individuals have a larger pupil, even in a “basic”, passive condition.
This would be related to the activity of the locus coeruleus (LC) and the noradrenergic system (LC-NS for Locus Coeruleus Norepinephrin System). Pupil size is generally a good estimate of LC activity. LC, which has projections throughout the brain and central nervous system, releases norepinephrine which facilitates the capture of important sensory information and the suppression of responses to small stimuli.
A LC-NS deficiency leads to cognitive impairment and attention.
Below, pupil size versus IQ (g factor).
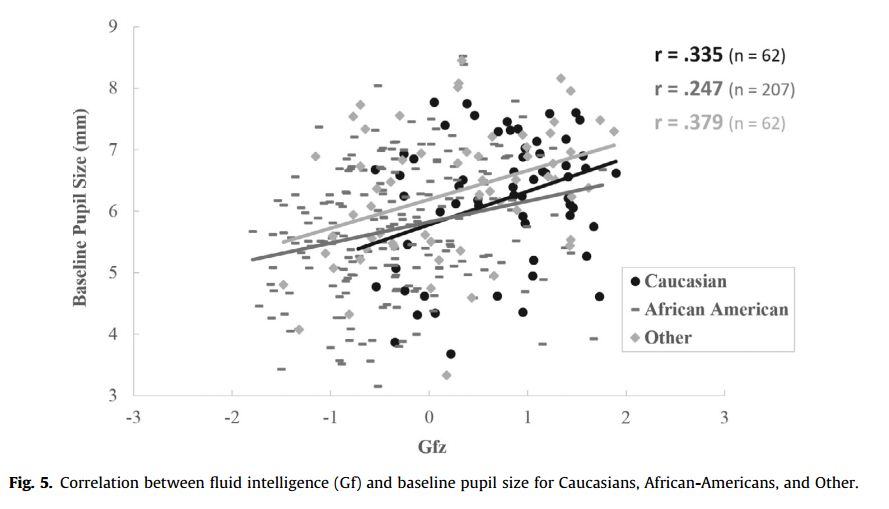
Reference: Tsukahara J.S et al. (2016) “The relationship between baseline pupil size and intelligence”, Cognitive Psychology 91, 109–123.
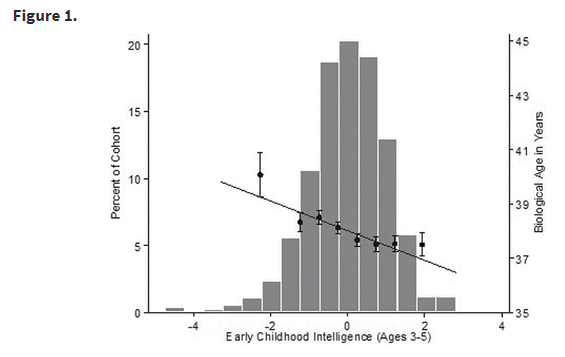
1.15 Telomere Lenght
There is a positive correlation between telomere length and intelligence. Intelligent individuals age more slowly, which explains their higher life expectancy. Low intelligence is very clearly a risk factor for accelerated aging.
A, B, C, E, F: Telomere size for tertile 1, 2 and 3 (tertile 1 = best results) at different intelligence tests.
D: Size of the telomeres according to reaction times. Smarter individuals have a faster reaction time.
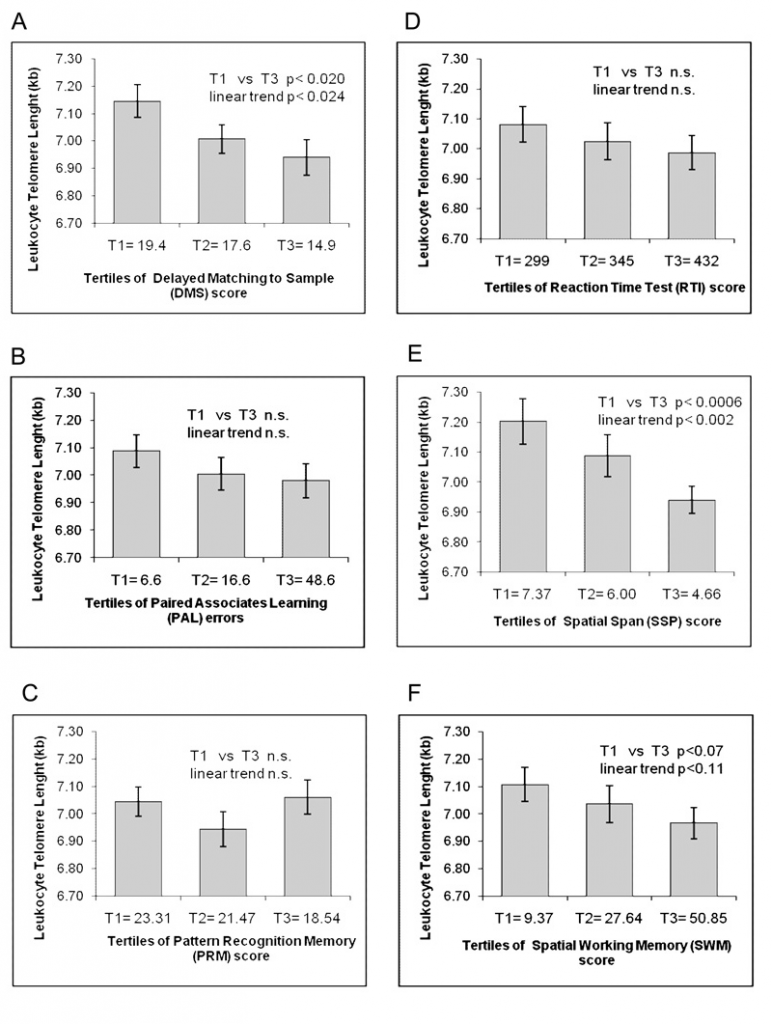
Figure 1: Biological age at age 38 according to intelligence (in SD) in early childhood
Reference:
Kingma E.M., De Jonge P., Van der Harst P., Ormel J. and Rosmalen J.G.M. (2012) The association between intelligence and telomere length: A longitudinal population based study PLoS One. 7(11): e49356.
Valdes A.M., Deary I.J., Gardner J., Kimura M., Lu X., Spector T.D., Aviv A. and Cherkas L.F., (2010) Leukocyte telomere length is associated with cognitive performance in healthy women, Neurobiol Aging. 31(6): 986–992.
Schaefer J.D. et al. (2016) Early-life intelligence predicts midlife biological age. The Journals of Gerontology: Series B, Volume 71, Issue 6, 17 Pages 968–977,
2.Social IQ Correaltions
2.1. National/Racial IQs Predict Success in Mathematics and Science
| Nations | IQ | Math & Science1964-86 |
Math 1994 Age 10 | Math 1994 Age 14 | Science 1994 Age 10 |
Science 1994 Age 14 |
| East Asia | 105 | 56.60 | 604 | 606 | 561 | 568 |
| China | 103 | 59.28 | – | – | – | – |
| Hong Kong | 107 | 56.93 | 587 | 588 | 533 | 522 |
| Japan | 105 | 60.65 | 597 | 605 | 574 | 571 |
| Singapore | 103 | 56.51 | 625 | 643 | 547 | 607 |
| South Korea | 109 | 56.21 | 611 | 607 | 597 | 565 |
| Taiwan | 105 | 56.28 | – | – | – | – |
| Europe | 98 | 52.84 | 545 | 530 | 549 | 532 |
| Australie | 98 | 48.13 | 546 | 530 | 562 | 545 |
| Austria | 100 | – | 559 | 539 | 565 | 558 |
| Belgium | 99 | 53.25 | – | – | 546 | 511 |
| Britain | 100 | 53.98 | 513 | 506 | 551 | 552 |
| Bulgarie | 93 | 59.28 | – | – | – | 565 |
| Canada | 99 | 47.57 | 532 | 527 | 549 | 531 |
| Czech Rep | 98 | – | 567 | 564 | 557 | 574 |
| Denmark | 98 | 53.48 | – | – | – | 478 |
| Finland | 99 | 48.76 | – | – | – | – |
| France | 98 | 54.15 | – | – | 538 | 498 |
| Germany | 98 | 59.03 | – | – | – | 531 |
| Greece | 92 | – | 492 | 484 | – | 497 |
| Hungary | 98 | 53.85 | 548 | 537 | 532 | 554 |
| Iceland | 101 | – | 474 | 487 | 505 | 494 |
| Ireland | 93 | 47.59 | 550 | 527 | 539 | 538 |
| Italy | 102 | 44.59 | – | – | – | – |
| Lithuanie | 90 | – | – | 477 | – | 476 |
| Netherlands | 101 | 56.84 | 577 | 541 | 557 | 560 |
| New Zeeland | 99 | 52.44 | 499 | 508 | 531 | 525 |
| Norway | 100 | 49.60 | 502 | 503 | 530 | 527 |
| Portugal | 95 | 50.28 | 475 | 454 | 480 | 480 |
| Romania | 94 | – | – | – | – | 486 |
| Russie | 97 | – | – | 538 | ||
| Spain | 98 | 49.40 | – | – | 487 | 517 |
| Slovakia | 96 | – | 547 | 544 | – | – |
| Slovenia | 96 | – | 552 | 541 | 546 | 560 |
| Sweden | 100 | 47.41 | – | – | – | 535 |
| Switzerland | 101 | 57.17 | – | 545 | ? | |
| United States | 98 | 43.43 | 545 | 500 | 534 | |
| South America | 86 | 30.10 | – | 385 | 411 | |
| Brazil | 86 | 33.91 | – | – | – | |
| Chile | 89 | 26.30 | – | – | – | |
| Colombia | 84 | – | – | 385 | – | 411 |
| South & SE Asia | 86 | 39.83 | 490 | 474 | 473 | 470 |
| Cyprus | 85 | – | 502 | 474 | 475 | 463 |
| Indic | 82 | 21.63 | – | – | – | – |
| Iran | 84 | 20.75 | 429 | 428 | 416 | 470 |
| Israel | 95 | 51.29 | 531 | 522 | 505 | 524 |
| Jordan | 84 | 39.38 | – | – | – | – |
| Kuwait | 86 | 400 | 392 | 401 | 430 | |
| Philippines | 86 | 34.35 | – | – | – | – |
| Thailand | 91 | 39.83 | 490 | 522 | 473 | 525 |
| Turkey | 90 | 41.52 | – | – | – | – |
| Africa | 69 | 32.00 | 354 | 326 | 326 | |
| Mozambique | 64 | 24.26 | – | – | ? | |
| Nigeria | 69 | 34.15 | – | – | ? | |
| South Africa | 72 | – | 354 | 326 | – | 326 |
| Swaziland | 68 | 32.00 | ||||
| Correlations
with IQ |
– | 0.81 | 0.85 | 0.89 | 0.81 | 0.82 |
2.2 IQ Predicts Salaries
Table 3. 1. Correlations between IQ and earnings
| Country | Number | Sex | Age | Age | r | Reference | |
| 1 | Netherlands | 835 | M | 12 | 43 | 0.17 | Dronkers, 1999 |
| 2 | Netherlands | 819 | M | 12 | 53 | 0.19 | Dronkers, 1999 |
| 3 | Netherlands | 350 | F | 12 | 43 | 0.03 | Dronkers, 1999 |
| 4 | Netherlands | 237 | F | 12 | 53 | 0.19 | Dronkers, 1999 |
| 5 | Norway | 1,082 | M/F | 18 | – | 0.33 | Tambs et al., 1989 |
| 6 | Sweden | 346 | M | 10 | 25 | 0.08 | Fagerlind, 1975 |
| 7 | Sweden | 460 | M | 10 | 30 | 0.22 | Fagerlind, 1975 |
| 8 | Sweden | 631 | M | 10 | 35 | 0.34 | Fagerlind, 1975 |
| 9 | Sweden | 707 | M | 10 | 43 | 0.40 | Fagerlind, 1975 |
| 10 | Sweden | 312 | M | 20 | 25 | 0.10 | Fagerlind, 1975 |
| 1 1 | Sweden | 410 | M | 20 | 30 | 0.22 | Fagerlind, 1975 |
| 12 | Sweden | 532 | M | 20 | 35 | 0.43 | Fagerlind, 1975 |
| 13 | Sweden | 585 | M | 20 | 43 | 0.50 | Fagerlind, 1975 |
| 14 | USA | – | M | 18 | 30 | 0.31 | Duncan, 1968 |
| 15 | USA | 345 | M | – | 19 | 0.15 | Hause, 1971 |
| 16 | USA | 345 | M | – | 24 | 0.29 | Hause, 1971 |
| 17 | USA | 345 | M | – | 29 | 0.45 | Hause, 1971 |
| 18 | USA | 345 | M | – | 34 | 0.49 | Hause, 1971 |
| 19 | USA | 4,388 | M | 17 | 25 | 0.26 | Hauser et al., 1973 |
| 20 | USA-whites | 24,812 | M | 18 | 30 | 0.24 | Brown & Reynolds, 1975 |
| 21 | USA-whites | 24,812 | M | 18 | 36 | 0.33 | Brown & Reynolds, 1975 |
| 27 | USA-blacks | 4,008 | M | 18 | 30 | 0.08 | Brown & Reynolds, 1975 |
| 23 | USA-blacks | 4,008 | M | 18 | 36 | 0.13 | Brown & Reynolds, 1975 |
| 24 | USA | 12,686 | M/F | 18 | 30 | 0.37 | Murray, 1998 |
| 25 | USA | 1,943 | M/F | 18 | 30 | 0.35 | Rowe et al., 1998 |
| 26 | USA | – | M | 12 | 45 | 0.53 | Judge et al., 1999 |
| 27 | USA-whites | 3,484 | M | 19 | 37 | 0.36 | Nyborg & Jensen, 2001 |
| 28 | USA-blacks | 493 | M | 19 | 37 | 0.37 | Nyborg & Jensen, 2001 |
| 29 | USA | 1,448 | M | 17 | 27 | 0.22 | Murnane et al., 2001 |
Table 3.3. Effects of IQ on earnings
| Country | Number | Sex | Age | Age | % Effect on | Reference | |
| 1 | USA | 692 | M | 12 | – | 15 | Crouse, 1979 |
| 2 | USA | 1,774 | M | 25-64 | 25-64 | 19 | Bishop, 1989 |
| 3 | USA | 1,593 | M | 15-18 | 19-34 | 17 | Neal & Johnson, 1996 |
| 4 | USA | 1,446 | F | 15-18 | 19-32 | 23 | Neal & Johnson, 1996 |
| 5 | USA | 1,448 | M | 17 | 27 | 19 | Murnane et al., 2001 |
| 6 | USA | 2,959 | M | 17 | 35 | 11 | Zax & Rees, 2002 |
| 7 | USA | 2,264 | M | 17 | 53 | 21 | Zax & Rees, 2002 |
| 8 | Sweden | 3,404 | M | 12 | 34 | 10 | Zetterberg, 2004 |
| 9 | Sweden | 3,277 | F | 12 | 34 | 11 | Zetterberg, 2004 |
2.3. IQ Predicts Educational Attainment
Table 3.4. Correlations between intelligence and educational attainment
| Country |
N |
Age |
Age |
Subject |
r |
Reference |
|
| 1 | Canada |
208 |
13 |
13 |
General |
0.55 |
Gagne & St. Pefi~-2002 |
| 2 | England |
85 |
5 |
16 |
English |
0.62 |
Yule et al., 1982 |
| 3 | England |
85 |
5 |
16 |
Math |
0.72 |
Yule et al., 1982 |
| 4 | Great Britain | 8,699 |
11 |
21 |
Years |
0.70 |
Thienpont & Verleye, 2003 |
| 5 | Great Britain | 20,000 |
11 |
16 |
GCSE |
0.74 |
Deary, 2004 |
| 6 | N. Ireland |
701 |
16 |
16 |
GCSE |
0.65 |
Lynn et al., 1984 |
| 7 | N. Ireland |
451 |
16 |
23 |
Level |
0.40 |
Cassidy & Lynn, 1991 |
| 8 | Norway | 1,082 |
18 |
18 |
Years |
0.50 |
Tambs et al., 1989 |
| 9 | Sweden |
570 |
20 |
20 |
Years |
0.53 |
Fagerlind, 1975 |
| 10 | USA |
– |
– |
– |
General |
0.71 |
Walberg, 1984 |
| 11 | USA |
455 |
13 |
13 |
Reading |
0.68 |
Lloyd & Barenblatt, 1984 |
| 12 | USA |
– |
18 |
18 |
Math |
0.66 |
Lubinski & Humphreys, 1996 |
| 13 | USA | 1,943 |
17 |
31 |
Yeats |
0.63 |
Rowe et al., 1998 |
| 14 | USA | 3,484 |
19 |
37 |
Yeats |
0.59 |
Nyborg & Jensen, 2001 |
| 15 | USA-blacks |
493 |
19 |
37 |
Yeats |
0.41 |
Nyborg & Jensen, 2001 |
| 16 | Switzerland |
82 |
11 |
11 |
Math |
0.45 |
Tewes, 2003 |
2.4. IQ Predicts Socioeconomic Status
Table 3.5. Correlations between intelligence and socioeconomic status
| Country |
N |
Sex |
Age |
Age |
r |
Reference |
|
| 1 | Britain |
5,038 |
M |
11 |
42 |
0.39 |
Nettle, 2003 |
| 2 | N. Ireland |
451 |
M/F |
16 |
23 |
0.24 |
Cassidy & Lynn, 1991 |
| 3 | Norway |
1,082 |
M |
18 |
0.33 |
Tambs et al., 1989 |
|
| 4 | Sweden |
346 |
M |
10 |
25 |
0.28 |
Fagerlind, 1975 |
| 5 | Sweden |
460 |
M |
10 |
30 |
0.35 |
Fagerlind, 1975 |
| 6 | Sweden |
631 |
M |
10 |
35 |
0.35 |
Fagerlind, 1975 |
| 7 | Sweden |
707 |
M |
10 |
43 |
0.40 |
Fagerlind, 1975 |
| 8 | Sweden |
312 |
M |
20 |
25 |
0.40 |
Fagerlind, 1975 |
| 9 | Sweden |
410 |
M |
20 |
30 |
0.48 |
Fagerlind, 1975 |
| 10 | Sweden |
532 |
M |
20 |
35 |
0.50 |
Fagerlind, 1975 |
| 11 | Sweden |
585 |
M |
20 |
43 |
0.53 |
Fagerlind, 1975 |
| 12 | USA |
81,553 |
M |
– |
– |
0.45 |
Stewart, 1947 |
| 13 | USA |
– |
M |
18 |
30 |
0.45 |
Duncan, 1968 |
| 14 | USA |
437 |
M |
11 |
45 |
0.46 |
Baiema, 1968 |
| 15 | USA |
4,388 |
M |
17 |
26 |
0.36 |
Sewell et al., 1970 |
| 16 | USA |
408 |
M |
17 |
36 |
0.41 |
Sewell et al., 1980 |
| 17 | USA |
330 |
F |
17 |
36 |
0.33 |
Sewell et al., 1980 |
| 18 | USA |
131 |
M |
16 |
– |
0.57 |
Waller, 1971 |
| 19 | USA |
170 |
M |
13 |
– |
0.50 |
Waller, 1971 |
| 20 | USA |
– |
M |
12 |
45 |
0.47 |
Judge et al., 1999 |
| 21 | USA-whites |
3,484 |
M |
19 |
37 |
0.38 |
Nyborg & Jensen, 2001 |
| 22 | USA-blacks |
493 |
M |
19 |
37 |
0.31 |
Nyborg & Jensen, 2001 |
2.5. IQ Predicts Trainability
Table 3.6. Correlations between intelligence and trainability
| Country | Complexity |
r |
Reference |
|
| 1 | United States | High |
0.58 |
Hunter & Hunter, 1984 |
| 2 | United States | Medium |
0.40 |
Hunter & Hunter, 1984 |
| 3 | United States | Low |
0.25 |
Hunter & Hunter, 1984 |
| 4 | United States | Electronics |
0.67 |
Hunter, 1986 |
| 5 | United States | Mechanical |
0.62 |
Hunter, 1986 |
| 6 | United States | Technical |
0.62 |
Hunter, 1986 |
| 7 | United States | Clerical |
0.58 |
Hunter, 1986 |
| 8 | United States | Combat |
0.45 |
Hunter, 1986 |
| 9 | Europe | High |
0.29 |
Salgado et al., 2003 |
| 10 | Europe | Medium |
0.29 |
Salgado et al., 2003 |
| 11 | Europe | Low |
0.23 |
Salgado et al., 2003 |
2.6. IQ Predicts Job Proficiency
|
Country
|
Complexity
|
r
|
Reference
|
|
|
1
|
United States
|
High
|
0.42
|
Ghiselli, 1966
|
|
2
|
United States
|
Medium
|
0.27
|
Ghiselli, 1966
|
|
3
|
United States
|
Low
|
0.15
|
Ghiselli, 1966
|
|
4
|
United States
|
High
|
0.57
|
Hunter & Hunter, 1984
|
|
5
|
United States
|
Medium
|
0.51
|
Hunter & Hunter, 1984
|
|
6
|
United States
|
Low-general
|
0.40
|
Hunter & Hunter, 1984
|
|
7
|
United States
|
Low-industriel
|
0.23
|
Hunter & Hunter, 1984
|
|
8
|
United States
|
All
|
0.51
|
Schmidt & Hunter, 1998
|
|
9
|
Europe
|
All
|
0.25
|
Salgado et al., 2003
|
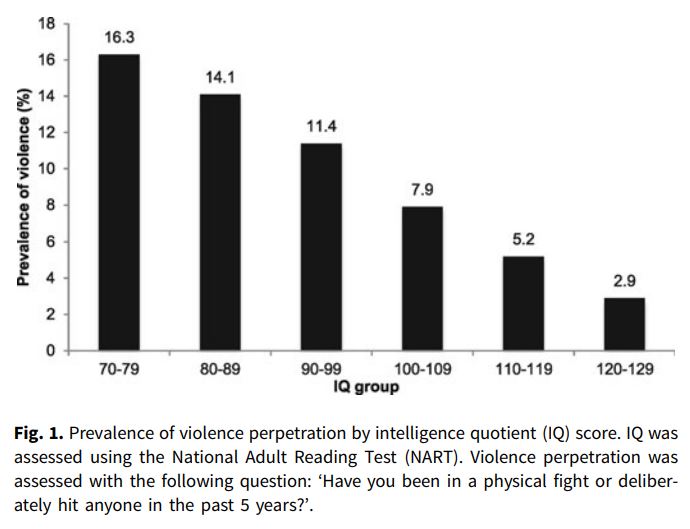
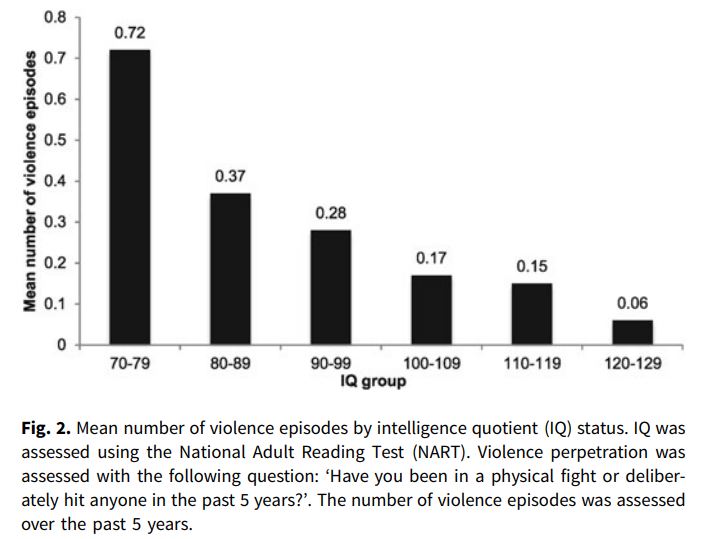
2.7. IQ and Violence
A lower IQ is linearly associated with higher violence in the general population.
2.8. IQ Predicts PISA Scores
| Nations | National IQ | Math 2000 Age 15 |
Science 2000 Age 15 |
Math 2003 Age 15 |
| Albania | 90 | 370 | 375 | – |
| Argentina | 93 | 380 | 395 | – |
| Australia | 98 | 533 | 525 | 524 |
| Austria | 100 | 515 | 520 | 506 |
| Belgium | 99 | 520 | 495 | 529 |
| Brazil | 86 | 330 | 375 | 356 |
| Bulgaria | 93 | 430 | 448 | – |
| Canada | 99 | 533 | 530 | 532 |
| Chile | 90 | 375 | 410 | – |
| China (Macao) | 105 | – | – | 527 |
| Czech Republic | 98 | 498 | 508 | 516 |
| Denmark | 98 | 514 | 515 | 514 |
| Finland | 99 | 536 | 540 | 544 |
| France | 98 | 517 | 500 | 511 |
| Germant’ | 99 | 490 | 480 | 503 |
| Greece | 92 | 447 | 455 | 445 |
| Hong Kong | 108 | 550 | 540 | 550 |
| Hungary | 98 | 488 | 498 | 490 |
| Iceland | 101 | 514 | 515 | 515 |
| Indonesia | 82 | 360 | 395 | 360 |
| Ireland | 93 | 503 | 510 | 503 |
| Israel | 95 | 435 | 438 | – |
| Italy | 102 | 457 | 475 | 466 |
| Japan | 105 | 557 | 550 | 534 |
| Latvia | 97 | 465 | 455 | 483 |
| Luxembourg | 100 | 446 | 445 | 493 |
| Macedonia | 91 | 370 | 400 | – |
| Mexico | 88 | 387 | 420 | 383 |
| Netherlands | 101 | – | – | 538 |
| New Zealand | 99 | 537 | 575 | 523 |
| Norway | 100 | 499 | 500 | 495 |
| Peru | 85 | 295 | 335 | – |
| Poland | 99 | 470 | 475 | 490 |
| Portugal | 95 | 452 | 455 | 466 |
| Russia | 97 | 480 | 455 | 468 |
| Serbia | 89 | – | – | 437 |
| Slovakia | 96 | – | – | 498 |
| South Korea | 106 | 547 | 550 | 542 |
| Spain | 98 | 476 | 485 | 485 |
| Sweden | 100 | 510 | 508 | 509 |
| Switzerland | 101 | 529 | 495 | 527 |
| Thailand | 91 | 430 | 440 | 417 |
| Tunisia | 83 | – | – | 359 |
| Turkey | 90 | – | – | 423 |
| United Kingdom | 100 | 529 | 535 | – |
| United States | 98 | 493 | 500 | 483 |
| Uruguay | 96 | – | – | 422 |
| Correlations with IQ | – | 0.876 | 0.833 | 0.871 |
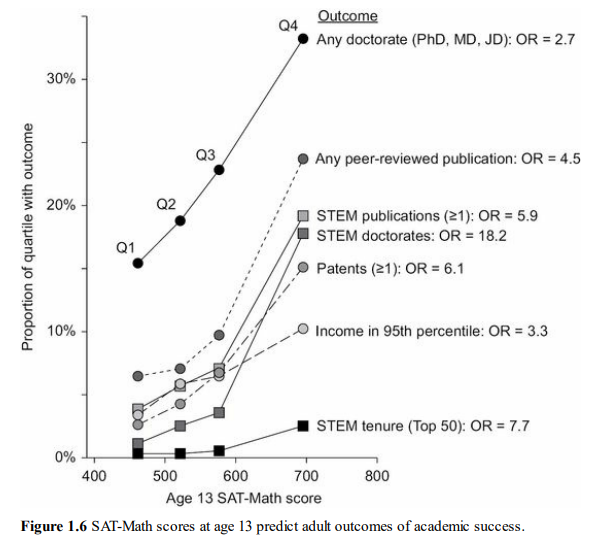
2.9. IQ measured at 13, predictive of many subsequent achievements
These are children with an IQ > 140. These children were divided into 4 quintiles. The Q4 represents the top 25% of these children with IQ > 140. The Q1 represents the 25% of the “least talented” among these children. We note that even among the very talented children, IQ remains highly predictive.