
IQ Statistics

1. Relationship Between National IQ and GDP per capita
2. National IQ Prediction Based on Racial Composition
9. Mean Salary Predicted from National IQ
1. Relationship between National IQ and GDP per Capita
GDP per Capita as a Function of National IQ
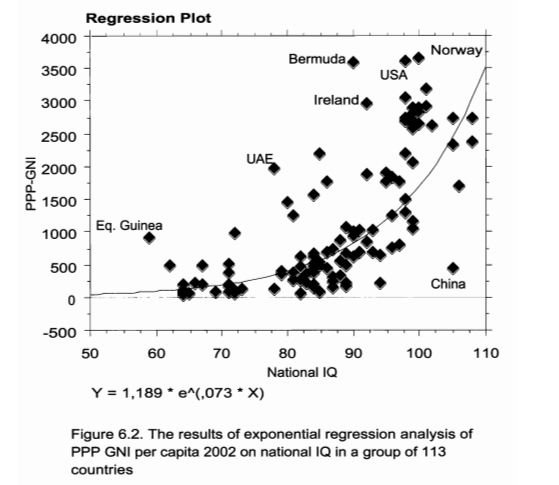
For further discussion of the link between the national IQ and economic development, see National IQ and Economy.
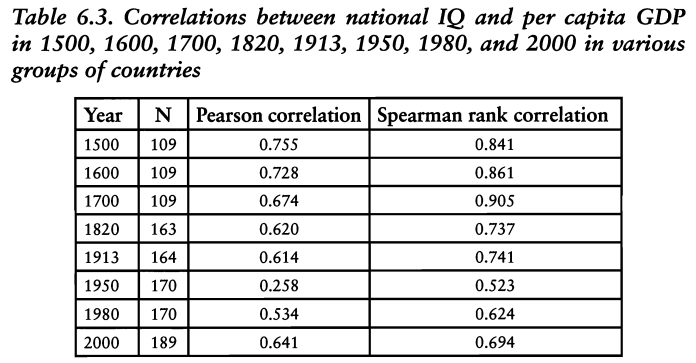
The following table shows that there has always been a strong correlation between IQ and GDP per capita, and this since at least the 1500PCN. The two weakest correlations, in 1950 and 1980, correspond to an increase in the GDP per capita of oil-producing countries, such as Kuwait, Qatar, and the United Arab Emirates, which have increased their average GDP per capita regardless of IQ.
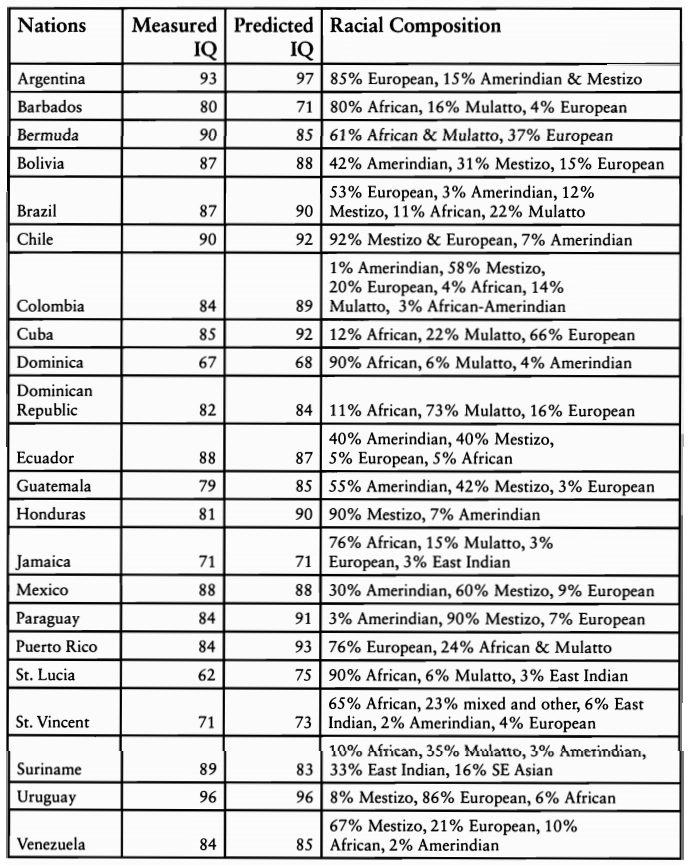
2. National IQ Prediction Based on Racial Composition
Table 9.7. National IQs in Latin America and the Caribbean predicted from the racial composition of the populations
3. IQ Heritability
| Ref | IQ HERITABILITY | Correlation |
| 1 | Monozygotic Twins reared together | 0.86 |
| 2 | Monozygotic Twins reared together | 0,85 |
| 2 | Monozygotic Twins reared apart | 0,74 |
| 2 | Dizygotic Twins reared together | 0,59 |
| 2 | Siblings reared together | 0.46 |
| 1 | Siblings or Dizygotic Twins reared together | 0.45 |
| 2 | Mid-parent / Child together | 0,50 |
| 2 | Single parent / Child together | 0,41 |
| 1 | Siblings or Dizygotic Twins reared apart | 0.40 |
| 13 | Between Husband and Wife | 0,45 |
| 17 | Between Husband and Wife | 0,37 |
| 18 | Between Husband and Wife in the USA | 0,33 |
| 1 | Half-siblings reared together | 0.20 à 0.30 |
| 2 | Single parent / Child apart | 0,24 |
| 2 | Adopting parent / Child together | 0,20 |
| 1 | Cousins reared together | 0.15 |
| 20 | Persons without any genetic parentage reared together during childhood | 0,25 |
| 20 | Persons without any genetic parentage reared together: when adults | – 0.01 |
| 19 | broad heritability according to age: – Children – in adolescents and young adults – Later maturity |
0.40 to 0.50 0.60 to 0.70 0.80 |
4. Various I.Q Correlations
| Ref | Correlation | |
| 7 | Head size | 0,40 |
| 8 | Level of aggression in primary school | -0,45 |
| 9 | Social Conservatism | -0,45 |
| 15 | Validity predicting Job Performance Rating | 0.53 |
| 16 | Myopia | 0.20 to 0.25 |
5. Mean I.Q
| Ref | QI | % > 100* | |
| 4 | African-Americans (about 25% of European admixture) | 85 | 16 |
| 22 | France: Mean I.Q. if the father is maneuver | 92 | 30 |
| 3 | US Prison population | 92 | 30 |
| 22 | France: Mean I.Q. of the child if the father is a farmer | 96 | 41 |
| 5 | Average European | 100 | 50 |
| 22 | France: Mean I.Q. of the child if the father is a commercial employee | 100 | 50 |
| 4 | East Asians (China, Korea, Japan, Singapore…) | 106 | 66 |
| 22 | France: I.Q. of the child if the father is a middle manager | 107 | 30 |
| 22 | France: I.Q. of the child if the father is a senior manager | 112 | 78 |
| 4 | Ashkenazy Jews | 115 | 85 |
| 3 | University Master Level | 115 | 85 |
| 3 | Plus hauts diplômés Américains | 145 | 99 |
*: Percentage of people in the population with an IQ> 100
6. Impact on Mean IQ (expressed in Wechsler I.Q. points)
| Ref | IMPACT | % > 100* | |
| 10 | IQ of hospitalized schizophrenics compared to the corresponding general population (expressed in relative terms) | -31 | 2 |
| 10 | IQ of non-hospitalized schizophrenics compared to the corresponding general population (expressed in relative terms) | -13 | 19 |
| 21 | IQ of Monozygotic Twins if both are born viable (expressed in relative terms) | -5 | 37 |
| 21 | IQ of Monozygotic Twins of which one is stillborn (expressed in relative terms) | 0 | 50 |
| 29 | IQ of Twins at the age of 5 | -5,3 | 37 |
| 29 | IQ of Twins at the age of 9 | -6 | 34 |
| 24 | IQ of 9-year-old children who have suffered at least once a year from the parasite G. lamblia (causes diarrhea) | -4 | 40 |
| 24 | IQ of 9-year-old children who suffered from chronic malnutrition during the first two years of stunted growth | -10 | 25 |
| 28 | IQ of 5-year-old children who had cried a lot at 6 and 13 weeks, 6, 9, and 13 months | -9 | 27 |
| 28 | IQ of 5-year-old children who had a lot of colic at 6 and 13 weeks, 6, 9, and 13 months | 0 (pas d’impact trouvé) | 50 |
*: Percentage of people in the population with an IQ> 100
7. IQ of Condemned People
| Ref | (US) MEAN IQ ACCORDING TO DEEPEST LEVEL OF CONTACT WITH THE CRIMINAL JUSTICE SYSTEM, WHITE MALES | QI | % > 100* |
| 6 | None | 106 | 66 |
| 6 | Stopped by the police but not booked | 103 | 58 |
| 6 | Booked but not convicted | 101 | 53 |
| 6 | Convicted but not incarcerated | 100 | 50 |
| 6 | Sentenced to a correctional facility | 93 | 32 |
*: Percentage of people in the population with an IQ> 100
8. Various Statistics
| Ref | STATISTIQUES DIVERSES CONCERNANT LE QI | CHIFFRE |
| 12 | On the crimes committed by educated children in the USA, the percentage of those committed by those with an IQ between 70 and 100 | 74% |
| 0 | IQ of Baccalaureate if 80% of the population has to get it | 88 |
| 16 | Percent of females exceeding the male median in spatial visualization ability | 25% |
| 27 | Birth weight: IQ points for 1 kg more, boys | 4,6 |
| 27 | Birth weight: IQ points for 1 kg more, girls | 2,8 |
| 23 | Correlation with economic success (see below) | 0,757 |
| 25 | Correlation with religiosity (percentage of people responding that religion is “very important”) | -0,886 |
| 26 | Correlation with the suicide rate | Men: 0,36 Women: 0,49 |
| 30 | Mean IQ when an adult, according to the age of the first sentence uttered | Before 24 months: 107 24 months: 101.8 After 24 months: 100.6 |
9. National IQ and Economic Success
(The National IQ data here comes from “IQ and the Wealth of Nations,” Lynn and Vanhanen, 2002. Since then, better data has been obtained (see National IQ and Economy).
About 60% of the economic variations between countries are explained by the IQ variations of the population. 3 elements come down the correlation (which, without them, would be even more important):
o The degree of economic freedom: countries that have lived (or still live) under communism are, of course, much poorer than the others
o The quantity of natural resources (eg, oil in the Middle East)
o The internal organization of the country: putting the intellectual elite in economic power increases the global wealth of all.
Légende
o Fitted GDP (FGDP) = “theorical” GDP estimates from National I.Q
o GDP / FGDP = indicates whether the country is doing better or worse than its IQ suggests
| Country | average IQ | GDP | fitted GDP | GDP/FGDP |
| Hong Kong | 107 | 20 763 | 19 817 | 1,0477368 |
| Korea, South | 106 | 13 478 | 19 298 | 0,6984143 |
| Japan | 105 | 23 257 | 18 779 | 1,2384579 |
| Taiwan | 104 | 13 000 | 18 260 | 0,7119387 |
| Singapore | 103 | 24 210 | 17 740 | 1,3647125 |
| Austria | 102 | 23 166 | 17 221 | 1,345218 |
| Germany | 102 | 22 169 | 17 221 | 1,2873236 |
| Italy | 102 | 20 585 | 17 221 | 1,1953429 |
| Netherlands | 102 | 22 176 | 17 221 | 1,2877301 |
| Sweden | 101 | 20 659 | 16 702 | 1,2369177 |
| Switzerland | 101 | 25 512 | 16 702 | 1,5274817 |
| Belgium | 100 | 23 223 | 16 183 | 1,4350244 |
| China | 100 | 3 105 | 16 183 | 0,191868 |
| NewZealand | 100 | 17 288 | 16 183 | 1,0682815 |
| U. Kingdom | 100 | 20 336 | 16 183 | 1,2566273 |
| Hungary | 99 | 10 232 | 15 664 | 0,6532176 |
| Poland | 99 | 7 619 | 15 664 | 0,4864019 |
| Australia | 98 | 22 452 | 15 145 | 1,4824695 |
| Denmark | 98 | 24 218 | 15 145 | 1,5990756 |
| France | 98 | 21 175 | 15 145 | 1,3981512 |
| Norway | 98 | 26 342 | 15 145 | 1,7393199 |
| United States | 98 | 29 605 | 15 145 | 1,9547706 |
| Canada | 97 | 23 582 | 14 626 | 1,6123342 |
| Czech Republic | 97 | 12 362 | 14 626 | 0,8452072 |
| Finland | 97 | 20 847 | 14 626 | 1,4253384 |
| Spain | 97 | 16 212 | 14 626 | 1,108437 |
| Argentina | 96 | 12 013 | 14 107 | 0,8515631 |
| Russia | 96 | 6 460 | 14 107 | 0,4579287 |
| Slovakia | 96 | 9 699 | 14 107 | 0,687531 |
| Uruguay | 96 | 8 623 | 14 107 | 0,6112568 |
| Portugal | 95 | 14 701 | 13 589 | 1,0818309 |
| Slovenia | 95 | 14 293 | 13 588 | 1,051884 |
| Israel | 94 | 17 301 | 13 069 | 1,3238197 |
| Romania | 94 | 5 648 | 13 069 | 0,4321677 |
| Bulgaria | 93 | 4 809 | 12 550 | 0,3831873 |
| Ireland | 93 | 21 482 | 12 550 | 1,7117131 |
| Greece | 92 | 13 943 | 12 031 | 1,1589228 |
| Malaysia | 92 | 8 137 | 12 031 | 0,6763361 |
| Thailand | 91 | 5 456 | 11 512 | 0,4739402 |
| Croatia | 90 | 6 749 | 10 993 | 0,6139361 |
| Peru | 90 | 4 282 | 10 993 | 0,3895206 |
| Turkey | 90 | 6 422 | 10 993 | 0,5841899 |
| Colombia | 89 | 6 006 | 10 474 | 0,5734199 |
| Indonesia | 89 | 2 651 | 10 474 | 0,2531029 |
| Suri name | 89 | 5 161 | 10 474 | 0,4927439 |
| Brazil | 87 | 6 625 | 9 436 | 0,7020983 |
| Iraq | 87 | 3 197 | 9 436 | 0,3388088 |
| Mexico | 87 | 7 704 | 9 436 | 0,8164476 |
| Samoa (Western) | 87 | 3 832 | 9 436 | 0,4061043 |
| Tonga | 87 | 3 000 | 9 436 | 0,3179313 |
| Lebanon | 86 | 4 326 | 8 917 | 0,4851407 |
| Philippines | 86 | 3 555 | 8 917 | 0,3986767 |
| Cuba | 85 | 3 967 | 8 398 | 0,4723744 |
| Morocco | 85 | 3 305 | 8 398 | 0,3935461 |
| Fiji | 84 | 4 231 | 7 879 | 0,5369971 |
| Iran | 84 | 5 121 | 7 879 | 0,6499556 |
| Marshall Islands | 84 | 3 000 | 7 879 | 0,380759 |
| Puerto Rico | 84 | 8 000 | 7 879 | 1,0153573 |
| Egypt | 83 | 3 041 | 7 360 | 0,4131793 |
| India | 81 | 2 077 | 6 322 | 0,3285353 |
| Ecuador | 80 | 3 003 | 5 803 | 0,517491 |
| Guatemala | 79 | 3 505 | 5 284 | 0,6633232 |
| Barbados | 78 | 12 001 | 4 765 | 2,5185729 |
| Nepal | 78 | 1 157 | 4 765 | 0,2428122 |
| Qatar | 78 | 20 987 | 4 765 | 4,4044071 |
| Zambia | 77 | 719 | 4 246 | 0,1693358 |
| Congo (Brazz) | 73 | 995 | 2 170 | 0,4585253 |
| Uganda | 73 | 1 074 | 2 170 | 0,4949309 |
| Jamaica | 72 | 3 389 | 1 651 | 2,0526953 |
| Kenya | 72 | 980 | 1 651 | 0,5935796 |
| South Africa | 72 | 8 488 | 1 651 | 5,1411266 |
| Sudan | 72 | 1 394 | 1 651 | 0,8443368 |
| Tanzania | 72 | 480 | 1 651 | 0,2907329 |
| Ghana | 71 | 1 735 | 1 132 | 1,5326855 |
| Nigeria | 67 | 795 | – 944 | -0,842161 |
| Guinea | 66 | 1 782 | – 1 463 | -1,218045 |
| Zimbabwe | 66 | 2 669 | – 1 463 | -1,824334 |
| Congo (Zaire) | 65 | 822 | – 1 982 | -0,414733 |
| Sierra Leone | 64 | 458 | – 2 501 | -0,183127 |
| Ethiopia | 63 | 574 | – 3 020 | -190,0662 |
| Equatorial Guinea | 59 | 1 817 | – 5 096 | -0,356554 |
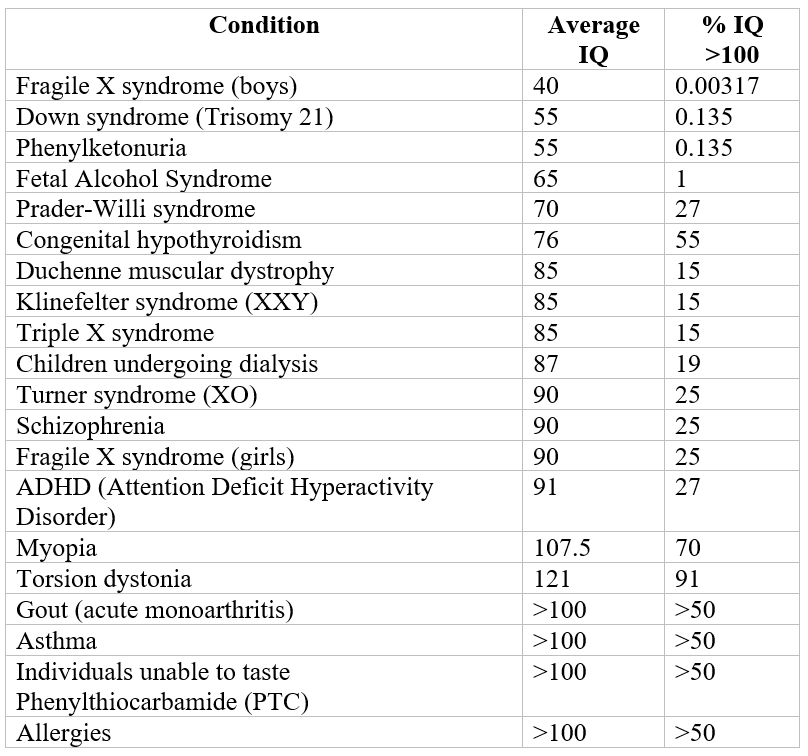
10. I.Q. and diseases
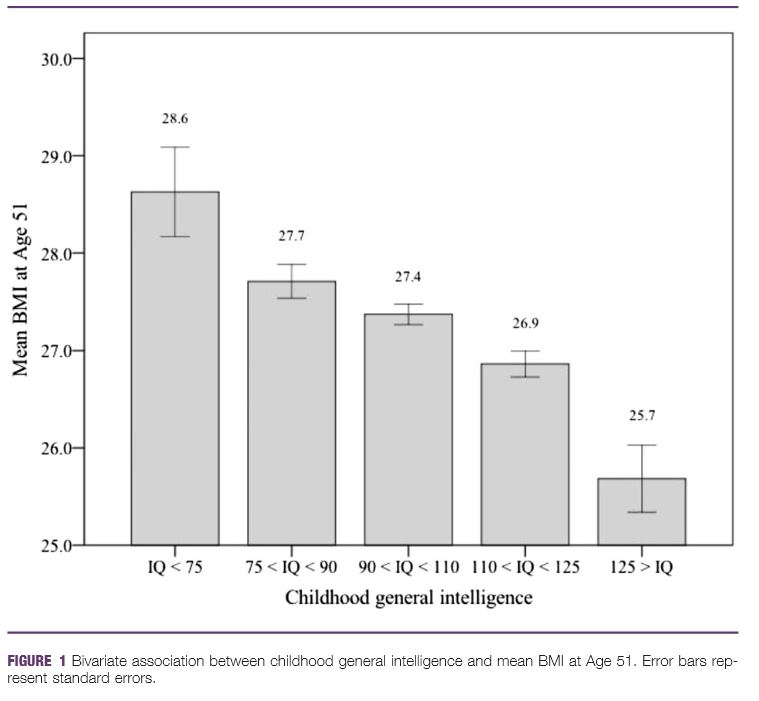
 11. I.Q. and BMI
12. I.Q. and Life Expectancy
There is a strong positive correlation between intelligence and longevity, higher IQs tend to live longer.
This correlation is mainly genetic. The genes involved in higher intelligence are also responsible for increasing longevity.
“The finding of common genetic effects between lifespan and intelligence has important implications for public health, and for those interested in the genetics of intelligence, lifespan, or inequalities in health outcomes, including lifespan.”
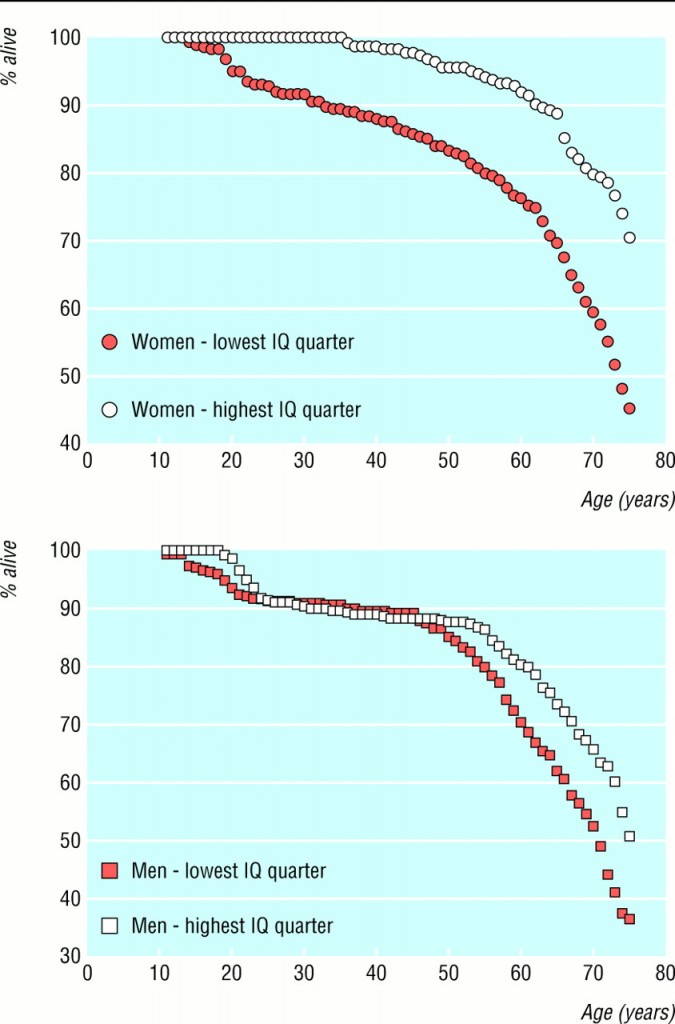
Survival curve in men and women: The lowest quartile is individuals with an IQ less than 90, and the highest quartile is individuals with an IQ greater than 110.
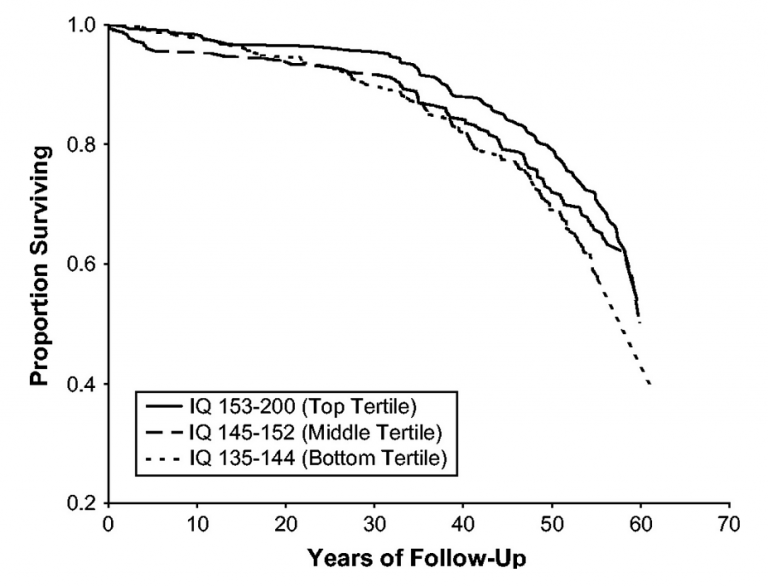
Among the most intelligent individuals, IQ remains correlated with longevity.
Sources and References
| Ref | SOURCES |
| 0 | Calculation for an average of 100 Only valid if the IQ distribution in the population considered follows a bell curve (this is true for the general population, but not necessarily for a particular population) |
| 1 | Jaques Bénesteau (sur ce site) |
| 2 | Devlin, Daniels, and Roeder – Nature 31-07-97 – Meta-analyse of 212 studies |
| 3 | Herrnstein & Murray – The Bell Curve (1994) |
| 4 | Estimation from Arthur HU |
| 5 | Per définition |
| 6 | TBC pp 246-247 |
| 7 | JP. Rushton – 2000 |
| 8 | Wiegmann and al. 1992 (Quoted by Brand 1996 pp 154 et 207 ) WIEGMAN, O., KUTTSCHREUTER, M. & BAARDA, B. (1992). ‘A longitudinal study of the effects of television viewing on aggressive and prosocial behaviours.‘ British Journal of Social Psychology 31, 147-164. |
| 9 | Egan 1989 |
| 10 | John Crawford 1992 |
| 11 | White, K.R. 1982 (quoted by Brand 1996) The relation between socioeconomic status and academic achievement Psychological Bulletin 91, 3, 461-8 |
| 12 | Yoshikawa |
| 13 | Jensen A.R. 1978 (Quoted in TBC pp 110 et 687): Genetic and behavioral effects of nonrandom mating. In Human Variation: Bpopsycholgy of Age, Race and Sex. R.T. Osborne, C.E. Noble, and N. Weyl (eds.). New York: Academic Press, pp. 5-105 Voir aussi : Jensen 1998 p 183 |
| 14 | Chris Brand |
| 15 | Hunter J. E. & Hunter R.F. 1984 (Quoted in TBC pp 81 and 575): Validity and utility of alternative predictors of job performance. Psychological Bull. 96:72-98 |
| 16 | Jensen 1998 – p 149 |
| 17 | Phil Rushton in ‘Race, Evolution and Behaviour‘ (1995), p. 70 (Diagram) |
| 18 | Tom Bouchard and Matt McGue in Familial studies of intelligence (1981, Science 212, 4498, 1055-1059) |
| 19 | Jensen 1998 – pp 169 et 178 + page 179 from Mac Gue 1993 |
| 20 | Jensen 1998, p 178 McGue et al., 1993, pp. 60-67 (Behavioral genetics of cognitive ability: a lifetime perspective in R. Plomin & G.E. McClearn (Eds.), Nature, Nurture, and Psychology (pp 59-76). Washington, DC: American Psychological Association) Scarr, 1989, pp 103-105 (Protecting general intelligence: constructs and consequences for interventions. In R.L. Linn (Ed.), Intelligence: Measurement, theory, and public policy (pp 74-118), Chicago: University of Illinois Press) Segal 1997 ( Same age unrelated siblilngs: a unique test of within-family environmental influences on IQ similarity, Journal of Educational Psychology, 89, 381-390) |
| 21 | RECORD, R. G., McKEOWN, T. & EDWARDS, J. H. (1970). An investigation of the differences in measured intelligence between twin and single births. Annals of Human Genetics 34, 11-20. |
| 22 | INED (France) 1973 |
| 23 | Lynn et Vanhanen 2002: “IQ and the Wealth of Nations” – Praeger (USA) 2002 |
| 24 | Douglas S. Berkman et al.: “Effects of stunting, diarrhoeal disease, and parasitic infection during infancy on cognition in late childhood: a follow-up study” in The Lancet, 16-02-2002 |
| 25 | Calculation of Razib (Gene Expression) from the data of # 23 and Pew. |
| 26 | Significant correlation found by VORACEK, Martin (2003), using the same data as Lynn & Vanhanen 2002 [24]. Personality and Individual Differences (in Press) |
| 27 | Thomas D Matte, Michaeline Bresnahan, Melissa D Begg, and Ezra Susser “Influence of variation in birth weight within normal range and within sibships on IQ at age 7 years: cohort study” BMJ, Aug 2001; 323: 310 – 314. |
| 28 | Rao MR, Brenner RA, Schisterman EF, Vik T, Mills JL. (2004): “Long-term cognitive development in children with prolonged crying.” Arch Dis Child. 2004 Nov;89(11):989-92. |
| 29 | Hagan (2005): “The cognitive cost of being a twin: evidence from comparisons within families in the Aberdeen children of the 1950s cohort study” BMJ Online First (Public release date: 18-Nov-2005) |
| 30 | Flensborg-Madsen T., Mortensen E.L. (2017) “Associations of Early Developmental Milestones With Adult Intelligence”, Child Development. |