
Intelligence is a highly heritable trait: roughly 85% of the observed variation in intelligence is attributed to genetic factors. The remaining 15% is influenced by what is called the “non-shared environment,” which includes factors such as prenatal conditions, childhood illnesses, and nutritional status during early development.
There are around a dozen major genetic subdivisions within the human species—commonly referred to as races or populations—that are genetically distinguishable. In biological terms, a race is a subdivision of a species that inherits specific characteristics that distinguish it from other populations of the same species. Genetically, a race is a population that shows different frequencies of certain genes as a result of isolation, typically geographic in nature.
Given these genetic differences among populations, it is statistically inevitable that cognitive differences also exist. Research has identified both quantitative and qualitative variations in brain structure and function between racial groups.
Cavalli-Sforza’s analyses in molecular biology support the existence of approximately a dozen genetically distinct clusters within Homo sapiens. For example, Africans and Caucasians can be genetically distinguished, having evolved in geographically isolated environments for over 100,000 years. Similarly, Caucasians and East Asians (sometimes referred to in older literature as “Mongoloid” populations) have been separated for approximately 40,000 years (Cavalli-Sforza, 2000).
For a more detailed examination of the biological basis of racial and population divisions, see Human Populations, Human Races.
Cognitive differences between populations are generally thought to be rooted primarily in genetic variation, especially differences in the frequencies of alleles associated with higher or lower intelligence. These may involve genes linked to brain size, neural conduction speed, or other neurophysiological processes. For a more comprehensive discussion of the genetic basis of intelligence, see Intelligence Is Highly Genetic.
1. General Summary of Race Differences in Intelligence
2. Africans, Europeans, and East Asians
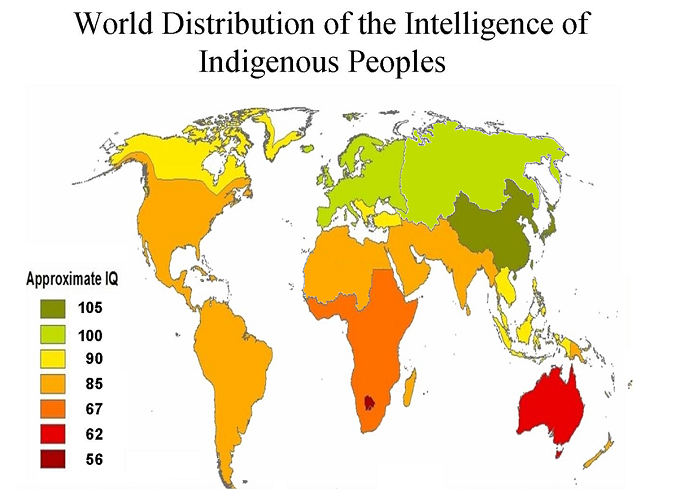
3. Geography of Intelligence
4. General Table
1. General Summary. Mean IQ of the Different Human Populations
1. Europeans
2. Africans
3. South Asians and North Africans
4. Southeast Asians
5. Australian Aborigines
6. Pacific Islanders
7. East Asians
8. Arctic People
9. Native Americans
(specific case of the Jews)
(Bushmen and Pygmies)
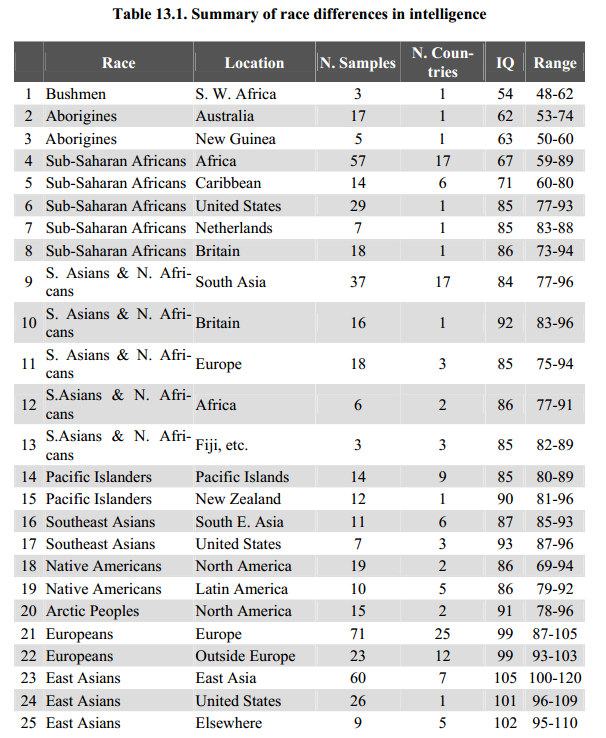
Line 1 gives a median IQ of 54 for Bushmen of the Kalahari desert from three studies in which the IQ ranges from 48 to 62. This corresponds to the mental age of an 8-year-old European.
Lines 2 and 3 give Aborigines in Australia and New Guinea an IQ of 62 and 63. Combining these two results gives a weighted IQ of 62, the mental age of a 10-year-old European.
Line 4 gives an IQ of 67 for Africans in sub-Saharan Africa from 57 different studies. This corresponds to the mental age of an 11-year-old European.
Line 5 gives an IQ of 71 for Africans in the Caribbean and Brazil, from 14 studies.
Line 6 gives an IQ of 85 for Africans in the United States, averaged from 29 studies.
Line 7 gives the same IQ of 85 for Africans in the Netherlands, derived from 7 studies.
Line 8 gives an almost identical IQ of 86 for Africans in Great Britain, coming from 18 studies. Thus, Africans outside Africa get higher IQs than Africans in Africa. There are two explanations for this. First of all, many Africans in the Caribbean, the United States, the Netherlands, and Britain are racial hybrids with appreciable amounts of European ancestry. Secondly, Africans living outside Africa live, to varying degrees, in societies largely managed by Europeans, and the standard of living is better, which increases I.Q. largely thanks to better nutrition.
Lines 9 to 13 give the IQ of South Asians and North Africans in various places.
Line 9 gives an IQ of 84 for South Asians and North Africans in their home country, from 37 studies in 17 countries. This is the mental age of a 13-year-old European.
Line 10 gives an IQ of 92 for South Asians and North Africans in Great Britain, from 16 studies.
Line 11 gives an IQ of 85 for South Asians and North Africans from Continental Europe from 18 studies in three countries.
Line 12 gives an IQ of 86 for South Asians and North Africans in Africa based on six studies in two countries.
Line 13 gives an IQ of 85 for South and North African Asians based on three studies in Fiji, Malaysia, and Mauritius.
The IQs of South Asians and North Africans are quite uniform, ranging from 84 to 91.
Line 14 gives an IQ of 85 for Pacific Islanders, from 14 samples
Line 15 gives an IQ of 90 from 12 studies for Pacific Island Maori (Pacific Islanders) in New Zealand. The reason why the Pacific Islanders’ IQ is higher in New Zealand is probably that they enjoy a higher standard of living because they live in a European-run country. For this reason, the IQ of 85 is adopted as the Pacific Islanders’ best IQ estimation.
Line 16 gives an IQ of 87 for Southeast Asians in their country of origin, from 11 studies in 6 countries.
Line 17 gives an IQ of 93 for Southeast Asians in the United States and the Netherlands. Their I.Q. is higher than in South Asia, probably because of selective migrations and better living conditions.
Line 18 gives an IQ of 86 for Amerindians in North America, from 19 studies.
Line 19 gives the same IQ of 86 for Amerindians in Latin America, from 9 studies from 5 countries. The IQ of 86 is adopted as the best estimate of the IQ of the Amerindians.
Line 20 gives an IQ of 91 for Eskimos from North America, from 15 studies in Alaska and Canada.
Line 21 gives an IQ of 99 for Europeans; this is the average of 66 studies in 25 countries (this median excludes the Balkans, which are mixed areas with South Asia).
Line 22 gives an IQ of 99 for Europeans outside Europe, from 23 studies in 12 countries. The median of all studies is 99 and is adopted as the best estimation of Europeans’ I.Q.
Line 23 gives an IQ of 105 for East Asians in their country of origin, which is an average of 60 studies in 7 countries.
Line 24 gives an IQ of 101 for East Asians in the United States from 26 studies.
Line 25 gives an IQ of 102 for East Asians in other locations, obtained from 9 studies in 5 countries (Belgium, Brazil, Canada, Malaysia, Netherlands).
2. Main Differences between Africans, Europeans, and East Asians
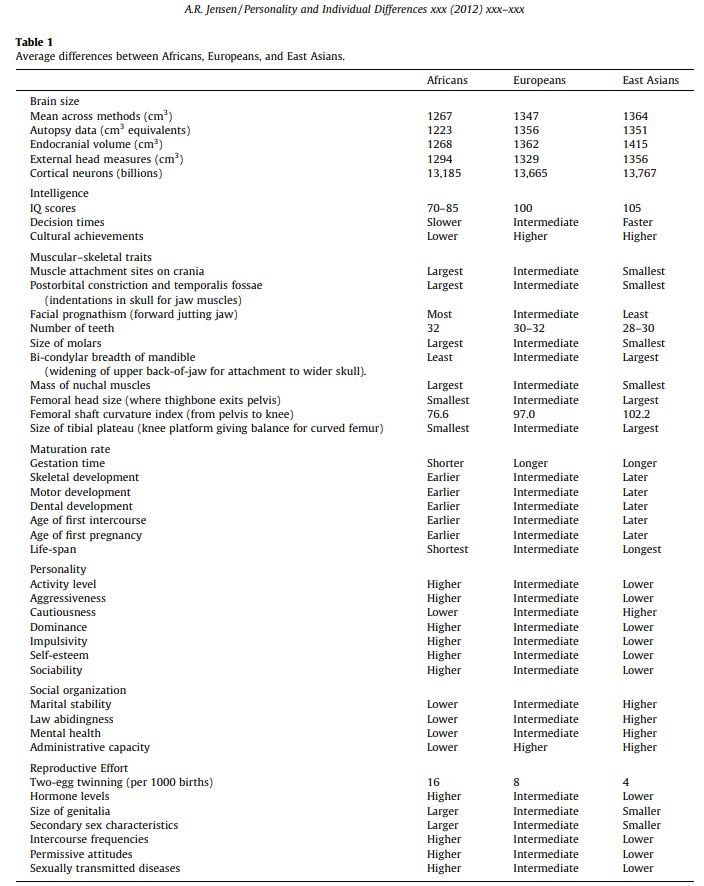
To go further, ‘Rushton Evolutionary Perspective’
3. Geography of Intelligence
4. General Table on Race Differences
Mean IQ, average cranial capacity, and different racial characteristics. Click on the image to enlarge.

References for this page
-
Genome-Wide Association Studies Establish that Human Intelligence Is Highly Heritable and Polygenic, Nature (2011).
-
Richard Lynn, Race Differences in Intelligence: An Evolutionary Analysis, Washington Summit Publishers, 2006 (Chapter 4, pp. 29–73).
-
J. P. Rushton, Race, Evolution and Behavior, 2000.