Sexual Differences
Summary
WAIS
Raven’s Progressive Matrices
Brain size
Evolution of Sex Differences in Intelligence
Summary
-
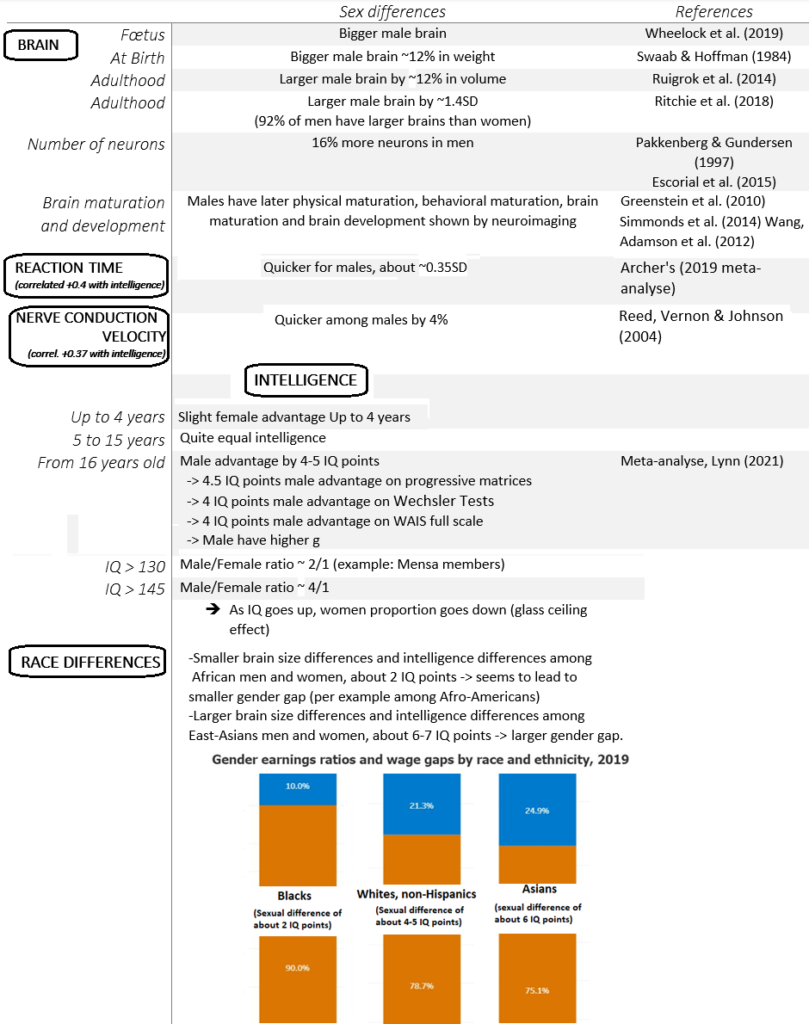
Adult males’ IQs are, on average, 4 to 5 points higher than those of adult females.
-
Females tend to develop faster than males, but their cognitive development also peaks earlier—paralleling patterns observed in physical growth.
-
Cerebral volume reaches its peak at approximately age 10.5 in females and 14.5 in males.
-
Male IQ becomes statistically superior around the age of 16.
-
Adult male brains are, on average, 110 to 150 cubic centimeters larger than female brains (δ = 0.78 SD).
-
Females have approximately 19.3 billion cortical neurons, compared to 22.8 billion in males.
-
Males have a higher average cortical thickness (δ = 0.28 SD).
-
Males demonstrate faster reaction times (Deary, 2006; Ritchie, 2018), which correlates positively with IQ.
-
Males also exhibit faster nerve conduction velocity (De Bellis, Keshavan, Beers et al., 2001), another factor positively associated with IQ.
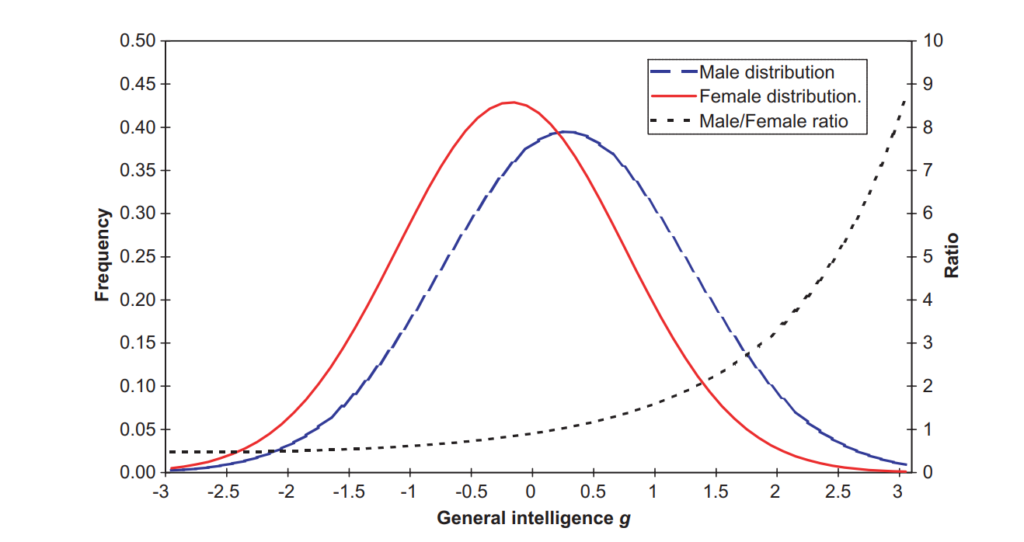
Fig. 1. Distribution of general intelligence (g) in the total male and female sample (HFA/S–L, see text), along with the male–female ratio as a function of g. For males, g = 0.23 (SD = 1.03); for females, g = –0.23 (SD = 0.93). Sample sizes: males (N = 90; mean age = 13.0, SD = 3.54), females (N = 91; mean age = 12.8, SD = 3.6).
Adult male brains are, on average, approximately 110 cm³ larger than female brains—a difference corresponding to 0.78 standard deviations (SD). Given the positive correlation between brain size and IQ (r = +0.35), the theoretical male IQ advantage can be calculated as:
0.78 × 0.35 = 0.273 SD,
which translates to roughly 4 IQ points (0.273 × 15), consistent with empirical findings from standardized intelligence tests.
Until approximately age 15, males and females exhibit comparable levels of general intelligence, with the exception of a small male advantage in spatial visualization abilities. However, from age 16 onwards, males begin to show a statistically significant advantage in general intelligence, reaching an average difference of 3 to 5 IQ points in adulthood. These findings have been supported by several researchers, including Paul Irwing (Irwing & Lynn, 2005; Irwing, 2012), as well as Victoria Bourne, Helen Fox, Ian Deary, and Lawrence Whalley (2007).
This male advantage in adult intelligence is fully accounted for by the larger average brain size in men. Since males and females generally experience similar environments, environmental factors cannot explain this cognitive difference. From an evolutionary perspective, the slight male advantage in intelligence is hypothesized to result from intrasexual competition—i.e., men competing with other men to gain access to women—where intelligence played a crucial role in reproductive success. In contrast, evolutionary pressures did not select for greater intelligence in women, as they did not compete for access to male partners in the same way.
Summary on Sex Differences in Intelligence by Richard Lynn (2017).
WAIS (Wechsler Adult Intelligence Scale)
All 42 studies consistently report a male advantage in general intelligence, with a median effect size of +0.24 standard deviations—equivalent to approximately 4 IQ points.
Table 5.5. Sex differences on the WAIS Full Scale IQ and Performance subtests; (ds; positive signs denote males score higher)
| Country | Test: N | Full Scale IQ d | Reference |
| Brazil | WAIS-III: 3494 | .07 | Victora et al., 2015 |
| Canada | WAIS-III: 1104 | .11 | Longman et al., 2007 |
| Chile | WAIS-IV: 887 | .20 | Diaz & Lynn, 2016 |
| China | WAIS-R:1406 | .24 | Dai et al., 1991 |
| China | WAIS-R:1979 | .33 | Lynn & Dai, 1993 |
| China | WAIS-R:120 | .43 | Yao et al., 2004 |
| China | WAIS-111:888 | .29 | Chen & Lynn , 2020c |
| China | WAIS IV:311 | .62 | Gao et al., 2015 |
| Canada | WAIS 111:1104 | .11 | Longman et al., 2007 |
| Denmark | WAIS:62 | .21 | Nyborg, 2005 |
| Germany | WAIS-IV:1425 | .21 | Daseking et al., 2017 |
| Italy | WAIS-R:1168 | .45 | Tommasi et al., 2015 |
| Japan | WAIS-R:1402 | .22 | Hattori & Lynn, 1997 |
| Netherlands | WAIS:2100 | .27 | Stinissen, 1977 |
| Netherlands | WAIS 111:522 | .24 | Van der Sluis et al, 2006 |
| Romania | WAIS:100 | .44 | Dumitrascu, 1999 |
| Romania: Roma | WAIS:100 | .44 | Dumitrascu, 1999 |
| Russia | WAIS:296 | .13 | Grigoriev et al, 2016 |
| Russia | WAIS:1800 | .22 | Grigoriev et al, 2016 |
| Scotland | WAIS-R:200 | .39 | Lynn, 1998 |
| South Korea | WAIS-IV:1228 | .31 | Lynn & Hur, 2016 |
| Spain | WAIS 111:1369 | .24 | Colom et al., 2002 |
| Sudan | WAIS-R:330 | .31 | Sulman et al, 2018 |
| Sudan | WAIS-R:319 | .21 | Sulman et al, 2018 |
| Taiwan | WAIS 111:888 | .29 | Chen & Lynn, 2021a |
| Taiwan | WAIS 1V:1105 | .35 | Chen & Lynn, 2018 |
| United States | W-Bell:235 | .59 | Strange & Palmer, 1953 |
| United States | W-Bell:153 | .20 | Norman, 1953 |
| United States | W-Bell:392 | .29 | Goolishian & Foster, 1954 |
| United States | WAIS:1700 | .10 | Matarazzo, 1972 |
| United States | WAIS:279 | .40 | Boor, 1975 |
| United States | WAIS:588 | .17 | Horn et al., 1979 |
| United States | WAIS:521 | .13 | Turner & Willerman, 1977 |
| United States | WAIS:649 | .09 | Doppelt & Wallace, 1955 |
| United States | WAIS:649 | .09 | Doppelt & Wallace, 1955 |
| United States | WAIS:100 | .33 | Shaw, 1965 |
| United States | WAIS-R:230 | .27 | Arceneaux et al., 1996 |
| United States | WAIS-R:206 | .28 | Ilai & Willerman, 1989 |
| United States | WAIS-R:1880 | .15 | Matarazzo et al., 1986 |
| United States | WAIS-III: 2450 | .18 | Irwing, 2912 |
| United States | WAIS IV:2200 | .15 | Piffer, 2016 |
| United States | WAIS 111: 850 | .04 | Du Pont et al., 2020 |
| Median | .24 |
Raven’s Progressive Matrices
Of the 33 studies reviewed, 32 found a male advantage in general intelligence, with a median effect size of 0.3 standard deviations—equivalent to approximately 4.5 IQ points.
Table 4.3. Sex differences (ds) for the Standard and Advanced Progressive Matrices in general population samples aged 20-80 years. Minus signs denote higher means obtained by females.
| Country | N:M | N:F | d | Reference |
| Britain | 300 | 240 | .29 | Heron & Chown, 1967 |
| Hungary | 250 | 250 | .17 | Szegedi, 1974 |
| Israel | 100 | 100 | .31 | Guttman, 1974. |
| Hawaii | 939 | 971 | .37 | Wilson et al., 1975 |
| Taiwan | 225 | 225 | 1.33 | Adair & Pollitt, 1985 |
| Belgium | 850 | 979 | .31 | Deltour, 1993 |
| Belgium | 101 | 174 | .38 | Deltour, 1993 |
| USA | 63 | 80 | .16 | Sitkei & Michael, 1996 |
| Belgium ** | 564 | 802 | .21 | Dufouil et al., 1997 |
| Brazil | 1921 | 741 | .28 | Campos, 1999 |
| USA** | 92 | 114 | .31 | Salthouse, 2001 |
| Scotland | 210 | 217 | .11 | Deary et al., 2004 |
| Scotland | 230 | 313 | .29 | Deary et al., 2004 |
| Guatemala | 683 | 786 | .52 | Martorell et al., 2005 |
| Brazil** | 104 | 265 | .49 | Rossetti et al., 2009 |
| Pakistan | 997 | 1019 | .04 | Ahmad et al., 2008 |
| Morocco | 92 | 110 | .38 | Sellami et al., 2010 |
| Spain | 101 | 157 | .15 | Diaz et al., 2010. |
| Sudan | 115 | 125 | .12 | Khaleefa et al., 2010 |
| N. Zealand | 143 | 187 | .22 | Fletcher & Hattie, 2011 |
| Argentina | 374 | 390 | -.02 | Flynn, 2012 |
| Libya | 300 | 300 | .37 | Al-Shahomee, 2012 |
| Libya | 260 | 260 | .36 | Al-Shahomee & Lynn, 2012 |
| Brazil** | 454 | 534 | .10 | Flores-Mendoza et al., 2013 |
| Brazil** | 161 | 386 | .65 | Braga et al., 2014 |
| Serbia | 62 | 74 | .27 | Čvorović & Lynn, 2014 |
| Romania* | 618 | 823 | .18 | Iliescu et al., 2016 |
| Australia** | 128 | 327 | .30 | Waschl et al, 2016 |
| Brazil** | 381 | 216 | .43 | Flores-Mendoza et al., 2016 |
| USA*** | 393 | 503 | .21 | Van der Linden et al., 2017 |
| Poland** | 218 | 218 | .12 | Gignac & Zajenkowski, 2019 |
| USA*** | 346 | 399 | .05 | Du Pont et al., 2020 |
| Portugal | 250 | 272 | .34 | Queiro-Garcia et al., 2021 |
| Median | – | – | .30 | – |
*Progressive Matrices Plus; **Advanced Progressive Matrices; *** Advanced Progressive Matrices Short Form
Brain Size
Boys and girls have about the same IQ up to 15 years old. From the age of 16, the average IQ of males becomes higher, with an advantage increasing to approximately 4 IQ points in adulthood.
The reason for this is that the brain size of males increases relative to that of females from the age of 16 shown by Lenroot, Gogtay, Greenstein, Wells et al. (2007) and Lenroot & Giedd (2010) and confirmed by neurological studies that have shown that white matter in the brain continues to grow more in males than in females from mid-adolescence (Simmonds, Hallquist, Asato & Luna, 2014; Wang, Adamson, Yuan, Altaye, Rajagopal, Byars & Holland, 2012). This thesis has been further supported by studies showing that males have later physical maturation (Hills & Byrne, 2010), behavioural maturation (Greenstein, Blachstein & Vakil, 2010; Keulers, Evers, Stiers & Jollies, 2010; Yurgelun-Todd, 2007), brain maturation (De Bellis, Keshavan, Beers et al., 2001) and brain development shown by neuroimaging by Bramen, Hranilovich, Dahl et al. (2010) and by Tiemeier, Lenroot, Greenstein et al. (2010).
The effect of the increasing brain size of males compared with that of females from the age of 16 years is that male intelligence increases relative to that of females.
Table 2.1. Sex differences in intelligence at ages 12 through 21 (ds; positive signs denote males score higher). AR: abstract reasoning.
| Age | 12 | 13 | 14 | 15 | 16 | 17 | 18 | 19 | 20 | 21 | Reference |
| Female per cent brain size | 92.2 | 92.5 | 92.6 | 91.5 | 91.2 | 89.2 | – | – | – | 86.6 | Roche & Malina, 1983; Rushton, 1992 |
| Sex diffs brain size cc | 110 | 120 | 127 | 133 | 140 | 150 | 160 | 170 | – | Giedd et al., 2012 | |
| US: AR | – | – | 0 | .04 | .09 | .10 | .16 | – | – | – | Feingold, 1988 |
| UK: AR | – | – | .06 | .08 | .08 | .19 | .25 | – | – | – | Lynn, 1992 |
| Spain: AR | .05 | -.20. | .14 | .31 | .32 | .38 | .36 | – | – | – | Colom & Lynn, 2004 |
| US: whites: g | – | – | – | -.03 | .26 | .29 | .17 | .23 | .32 | .41 | Meisenberg, 2009 |
| US: blacks: g | – | – | – | -.11 | .07 | .05 | .07 | .00 | .10 | .10 | Meisenberg, 2009 |
| UK: g | -.06 | – | – | – | .12 | – | – | – | – | – | Lynn & Kanazawa, 2011 |
| US:DAT | -.80 | – | – | .60 | – | -3 | – | – | – | – | Keith et al., 2011 |
| US: CogAT | -.03 | -.01 | – | -.01 | – | .03 | – | – | – | – | Lakin, 2013 |
| US: whites: g | .08 | .10. | .02 | .16 | .23 | .26 | – | – | – | – | Nyborg, 2015 |
| US: blacks: g | -.13 | -.18 | -.04 | -.19 | -.34 | .43 | – | – | – | – | Nyborg, 2015 |
| US: Hispanics: g | .02 | .11 | -.08 | .24 | -.23 | .30 | – | – | – | – | Nyborg, 2015 |
| Spain: IQ | .07 | .01 | .08 | .19 | .27 | .25 | .32 | – | – | – | Arribas-Agula et al., 2019 |
| Spain: Verbal ability | -.03 | -.07 | -.06 | .05 | .15 | .09 | .15 | – | – | – | Arribas-Agula et al., 2019 |
Row 1 gives the cranial capacity of females as a % of that of males. Cranial capacity of females as a percentage of that of males declines from the ages of 15 to 17 (data from Roche & Malina, 1983) and declines further at age 21+.
Row 2 gives the differences in brain size in cubic centimetres between males and females obtained by magnetic imaging : the differences increase over the ages 12 through 19.
Rows 3, 4, and 5 give Abstract Reasoning data from the Differential Aptitude Test for the United States, the United Kingdom, and Spain, all showing a male advantage from ages 14 through 18.
Row 6 gives results for 15- to 21-year-old whites for the ASVAB (Armed Services Vocational Aptitude Battery) scored for g, showing a female advantage at age 15 followed by increasing male advantages from age 16 reaching .41d (6.15 IQ points) at age 21.
Row 7 gives results from the same data for Blacks, also showing a female advantage at age 15 followed by male advantages from age 16 but these are very small and not statistically significant (smaller sex differences in intelligence among Africans, see below the evolutionary explanation of sex differences and sex differences).
Row 8 gives the differences in g for a UK longitudinal sample, showing girls at age 12 had a significantly higher score than boys but at age 16 the same boys had a significantly higher score than girls.
Row 9 gives results for the American DAT averaged from Gv (visual-spatial) (verbal), Glr (free recall memory),Gsm (short-term memory) and Gs (processing speed), showing girls scored higher at age 12 (also at ages 5-7 and 8-10) while boys scored higher at ages 14-15 and 16-17.
Row 10 gives results for the American CogAT averaged from verbal, quantitative and non-verbal reasoning ability, showing girls scored higher at age 12, 13 and 15 while boys scored higher at age 17.
Rows 11 through 13 give results for the NLSY 97 (National Longitudinal Study of Youth) scored for g for whites, blacks and Hispanics, showing generally small sex differences from ages 12 through 15 but significant male advantages at age 17.
Row 14 gives results for g (general intelligence) for Spain, showing no significant sex differences at ages 12 through 14, and increasingly higher scores by boys from ages 15 through 18.
Row 15 gives results for verbal ability for Spain, showing girls scored higher at age 12. In a Spanish sample there was a female advantage in 12- through 14-year-olds and male advantages from the age of 15 through 18 years of .05d increasing to .15d.
To calculate the magnitude of the higher adult male IQ predicted by the larger male brain size, I took Ankney’s figure of the male-female difference in brain size expressed in standard deviation units of 0.78d and Willerman et al.’s (1991) estimate of the correlation between brain size and intelligence of 0.35. These figures would give adult males a higher average IQ of 4.0 IQ points (0.78 multiplied by 0.35 = .27d = 4.0 IQ).
The Evolution of Sex Differences in Intelligence
In infants aged between 1 and 4, girls have higher average intelligence than boys. Between the ages of 6 and 15, there is virtually no difference in intelligence between males and females. At the age of 16, males begin to have higher average intelligence than females, increasing an advantage of 4 IQ points in adults.
The explanation of the higher intelligence of girls than of boys in infancy is that girls mature earlier than boys, as shown by Lenroot, Gogtay, Greenstein et al. (2007) in a longitudinal investigation of sex differences in brain development using magnetic resonance imaging (MRI) of 387 subjects aged 3 to 27 years, showing that cerebral volume peaked at age 10.5 in females and 14.5 in males. The likely evolutionary explanation of the earlier maturation of girls is that it is advantageous for them to begin reproducing in early puberty when they are sufficiently mature to have babies and look after them. Between the ages of 6 and 15 years, the greater brain size of boys compensates for their later maturation resulting in virtually no difference in average intelligence between males and females during these ages.
The likely evolutionary explanation of the higher intelligence of males from the age of 16 years is that in all mammalian group-living species, males compete for territory or high status in dominance hierarchies to secure access to females and reproduction, as documented in detail by Wynne-Edwards (1962) and Wilson (1975). During the evolution of the hominids, greater intelligence would have contributed to success in this male competition by enabling males with greater intelligence to form useful alliances, display leadership qualities in hunting and warfare, and to dominate other males with lesser intelligence. The continued maturation and increasing intelligence of males in later adolescence and into adulthood from the age of 16 years would have enabled males to acquire the experience and skills required to work their way up the dominance hierarchies and obtain sufficient status to secure access to females. In contrast, females do not need to acquire these skills. The advantage of intelligence is present in contemporary societies where it is a significant determinant of rank indexed by socio-economic status, as documented in the United States by Jencks (1972), who showed they are correlated at 0.46, and in Britain by Nettle (2003) and Saunders (2012, 2019).
A further probable evolutionary explanation for the higher average intelligence of men than of women lies in sexual selection, the process by which females tend to favour males with high intelligence and accept them as mates because they consider them likely to be good providers for themselves and their children. This theory was first advanced and described as sexual selection by Charles Darwin (1971) to explain why, in most species, males are bigger and stronger than females. Darwin argued that males have to compete with each other for mates, and females tend to accept those who are bigger and stronger and, in humans, more intelligent, with the result that “man has ultimately become superior to woman”. This thesis has been elaborated by Geoffrey Miller (2000) who writes: “Male nightingales sing more and male peacocks display more impressive visual ornaments. Male humans sing more and talk more in public gatherings, and produce more paintings and architecture… Men write more books. Men give more lectures. Men ask more questions after lectures. Men dominate mixed-sex committee discussions”. He argues that these are strategies successfully used by intelligent males to attract females.
The higher average intelligence of males than of females is greater in Europeans than in sub-Saharan Africans. This was shown by Jensen & Johnson (1994) who reported that among 7-year-old white boys had a 1.1 higher WISC IQ than girls, but among blacks, girls had a 0.6 higher IQ than boys. This difference was confirmed by Meisenberg (2009) who reported that among 20- and 21-year-olds the white male advantage was .356d but the black male advantage was only .10d. The difference was further confirmed by Nyborg (2015) who reported a female advantage of .24d on g in black 16-17 year-olds and a male advantage of .30d in whites. The same difference was reported for mathematical problem-solving ability, given as .23d for blacks and .41d for whites in the meta-analysis by Hyde, Fennema & Lamon (1990). Consistent with these results, Rushton (1992) reported that the male-female difference in brain size is greater in whites than in blacks. He reported that for enlisted military personnel the male-female difference in brain size was 204 cc. in whites and 189 cc. in blacks and for officers it was 210 cc. in whites and 197 cc. in blacks.
The likely evolutionary explanation for the greater advantage of males over females in intelligence in Europeans than in sub-Saharan Africans is that in the tropical and sub-tropical evolutionary environment of sub-Saharan Africa, black males had only a weak need for greater intelligence than females because plant and insect foods were available throughout the year and females could collect these for themselves and their children without the support of males. The effect of this was that males were only under weak selection pressure to evolve the higher intelligence required to hunt for animal foods. When early humans migrated into Europe, they found that plant and insect foods were not available in the winter and spring, and males had to hunt large animals to obtain food for themselves, their females, and their children. Hunting large animals is more cognitively demanding than gathering plant and insect foods, so European males came under selection pressure to evolve higher intelligence than females. In confirmation of this explanation, it has been shown by Humphreys, Lin & Fleishman (1976) that white males have significantly greater hunting ability than have white females, compared with that of black males and females.
If this theory is correct, the male intelligence advantage should be greater in North East Asians than in Europeans because North East Asians experienced a harsher and more cognitively demanding environment. This expectation is confirmed by the sex differences in the Wechsler Full IQs in the 45 adult samples given in Tables 5.4 and 5.5. Eight of these samples were North East Asians (four from China, two from Taiwan, one from Japan, and one from South Korea) in whom the median male advantage was .31d . The other thirty-seven were Europeans in whom the median male advantage was .21d.
References for the entire page
Lynn, R. (2021). ‘Sex Differences in Intelligence, The Developmental Theory’
Lynn, R. (2015). Race Differences in Intelligence: An Evolutionary Analysis (Chapter 16).
Deary, I. J. (2006). “Age and sex differences in reaction time in adulthood: Results from the United Kingdom Health and Lifestyle Survey,” Psychology and Aging.
Van der Linden, D., Curtis, S. D., & Madison, G. (2017). “Sex differences in brain size and general intelligence (g),” Intelligence.
Lynn, R., & Irwing, P. (2006). “Intelligence: Is there a sex difference in IQ scores?” Nature, 442, E1. doi:10.1038/nature04966
Arribas, D., Aguila, F., et al. (2019). “Testing the developmental theory of sex differences in intelligence using latent modeling: Evidence from the TEA Ability Battery (BAT-7).”
Lynn, R. (2017). “Sex Differences in Intelligence: Reply to Comments,” Mankind Quarterly, 58, 145–156.
APPENDIX