FAQ (Frequently Asked Questions) on Intelligence
> What Is Intelligence?
> Can We Measure Intelligence?
> Different Types of Intelligence?
> What does IQ mean?
> Each Population Its Intelligence?
> What Is the Impact of Racial Differences in Intelligence on Global Geopolitics?
> What Is the g Factor?
> What Does “Indifference to Indicators” Mean?
> What Are the Average g in the Animal World, Including Homo Sapiens?
> Is IQ in your genes?
What’s Intelligence?
To discuss any issue meaningfully, we must first define it clearly.
Qualitatively, most people view intelligence as a general ability arising from the brain’s activity.
But can this ability actually be quantified and ranked?
A common criticism of IQ testing is that intelligence cannot be measured or arranged in a meaningful hierarchy.
How valid is this criticism?
Can We Measure Intelligence?
Intelligence is a biological, physiological, and organic characteristic—much like height.
Modern neuroscience has largely moved beyond Cartesian dualism—the idea that the mind and body are separate entities. Instead, it embraces a monistic perspective, viewing the mind as inseparable from the brain. This view echoes the famous words of the 18th-century French physician Pierre-Jean-Georges Cabanis:
“The brain secretes thought as the liver secretes bile.”
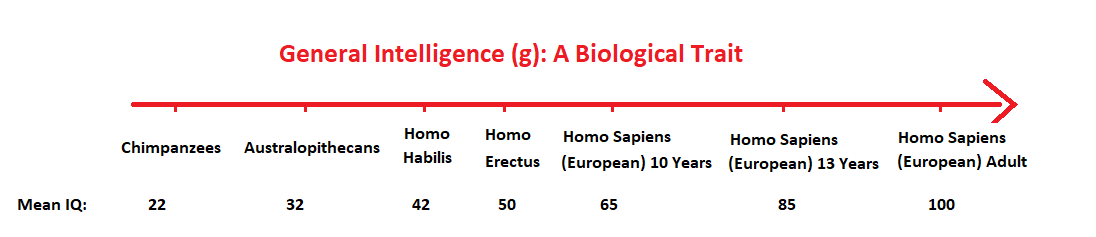
In this view, the mind is not an abstract entity but a direct product of the brain’s activity. Intelligence, as a biological trait, can therefore be measured and ranked. This hierarchy can be illustrated by the following examples:
-
Great apes, whose brains show higher central nervous system efficiency than those of dogs, have an average mental age of 2–3 years and an estimated average IQ of around 22.
-
Dogs are typically estimated to have an average IQ of 12.
-
A 5-year-old child, with an IQ of around 35, is more intelligent than a great ape.
-
A 10-year-old child generally has an IQ of 70, showing a higher level of cognitive ability than a 5-year-old.
-
An average adult, with an IQ of 100, surpasses the intelligence of a 10-year-old child.
Can we, however, establish a finer hierarchy—one that goes beyond broad comparisons such as child versus adult and distinguishes, for instance, between two adults of similar background?
To quantify intelligence meaningfully, we must first understand exactly what we are trying to measure.
Different Types of Intelligence?
If there truly were distinct and unrelated types of intelligence, a person highly skilled in one area could be completely deficient in another.
In that case, there would be no reliable way to quantify or rank intelligence as a whole.
However, research has shown that:
-
All cognitive abilities—even very different ones—are positively correlated.
-
Individuals who perform well in one cognitive domain tend to perform well in others.
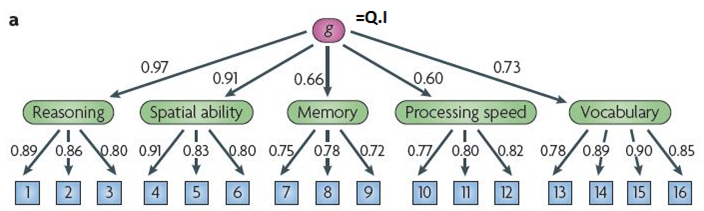
This finding led to the discovery of a common underlying factor known as g, or general intelligence.
IQ is designed to measure this general intelligence factor (g).
As a result, measuring a few key aptitudes is sufficient to estimate someone’s overall intelligence, since all of them reflect g to some extent.
Figure 2: General Intelligence (g) and Its Correlations
You can divide intelligence into as many categories as you wish—spatial, verbal, mathematical, social, musical, and so on.
You could even label them abstractly as I₁, I₂, I₃, I₄, I₅, I₆, I₇…
But the fact remains:
-
A person gifted in one domain is statistically likely to be gifted in others,
-
while a person with low ability in one area is likely to show low ability across the board.
This phenomenon underlies concepts such as intellectual disability—conditions that would make no sense if general intelligence did not exist.
The division of intelligence into multiple types (literary, mathematical, artistic, social, musical, economic, etc.) is largely a cultural construct rather than a concept rooted in biology or neuroscience.
From a biological perspective, human intelligence is best understood as a general trait with a strong single component, measured by the general intelligence factor (g).
As psychologist Arthur Jensen put it:
“One of the most remarkable discoveries of all psychology is that scores on all tests of each variety of mental ability are positively intercorrelated for any representative sample of the general population.”
Or, as other researchers have phrased it:
“g is to psychology what carbon is to chemistry.” – Chris Brand
“IQ is to sociology what gravity is to physics.” – Richard Lynn
“IQ is a fundamental part of society. We must stop the dysgenic trend in America.” – William Shockley, Nobel Prize in Physics, inventor of the transistor
In fact, all cognitive activities—even the simplest ones—show some degree of saturation in g, meaning they correlate with general intelligence.
This is true for activities processed through the central nervous system, including:
-
Logical reasoning
-
Spatial visualization
-
Memory
-
Musical ability
-
Language processing
-
Vocabulary acquisition
-
Basic cognitive tasks
Surprisingly, even low-level sensory tasks show measurable correlation with g:
-
Auditory discrimination: High-IQ individuals can detect smaller differences between sound frequencies.
-
Visual color perception: Those with higher intelligence can distinguish finer variations in hue.
-
Simple reaction time: Faster and more consistent responses are linked to higher IQ scores.
In short, all cognitive activities exhibit some correlation with general intelligence (also called g loading)—
similar to how all programs on a computer rely on its processor, though some demand more power than others.
Figure 3: Different Cognitive Activities and Their g Loading (Correlation with General Intelligence)
(From The g Factor, 1998, A. Jensen)
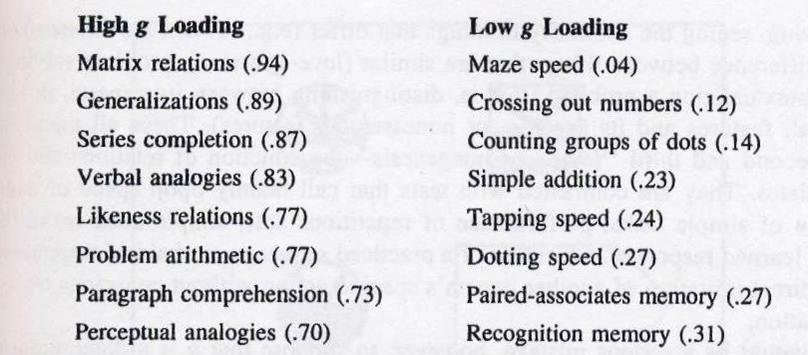
All mental activities provide some estimate of general intelligence (g), but not all are equally accurate.
For example, a simple arithmetic task such as basic addition offers only a weak estimate of g, with a g loading of just 0.23.
In contrast, Raven’s Progressive Matrices—a non-verbal test focused on pattern recognition and abstract reasoning—has a very high g loading of 0.94.
This means that strong performance on Raven’s Matrices is highly predictive of broader cognitive ability (abstraction, logical reasoning, and reflection) because it taps directly into general intelligence.
To illustrate:
If you want to test the speed of a computer, you wouldn’t use a lightweight program—because even a weak computer could run it effortlessly, revealing little about its power.
Instead, you would use a demanding application to see how the system performs under pressure. That’s how true processing capacity is measured.
Likewise, intelligence tests with high g loading—such as Raven’s Matrices—serve as cognitive stress tests, providing a more accurate picture of a person’s general intellectual potential.
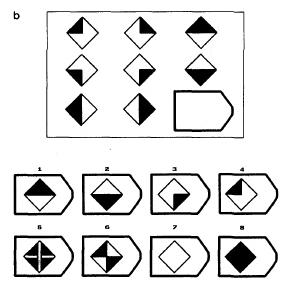
Raven’s Progressive Matrices are among the most effective tools for measuring general intelligence, with a g loading of 0.94.
This makes them one of the best estimators of general intelligence (g).
Taking an IQ test is essentially completing a series of cognitive tasks that are strong estimators of g—much like running high-demand software on a computer to evaluate its processing power.
Just as lightweight programs reveal little about a computer’s speed, simple mental tasks provide only a rough picture of someone’s intelligence.
By contrast, complex tasks with high g loading yield far more accurate assessments.
The validity of IQ is further supported by its strong predictive power for a wide range of social outcomes. For example:
-
A child’s IQ score is a robust predictor of future socioeconomic status.
-
It correlates strongly with educational attainment.
-
It also predicts numerous other life outcomes, such as job performance and health.
IQ is further supported by biological correlations, including:
-
Brain volume: Higher IQ is moderately correlated with larger brain size (r ≈ 0.35).
-
Nerve conduction velocity: Individuals with higher IQs tend to have faster neural processing.
and many other physiological markers linked to central-nervous-system efficiency.
For a deeper exploration of these links, see the section “Validity of IQ: Biological and Social Correlates of Intelligence.”
General intelligence (g) tends to increase throughout childhood alongside the natural growth of cranial capacity and reaches its peak around age 25.
From about 30 onward, it gradually declines, with a sharper decrease typically after the age of 80.
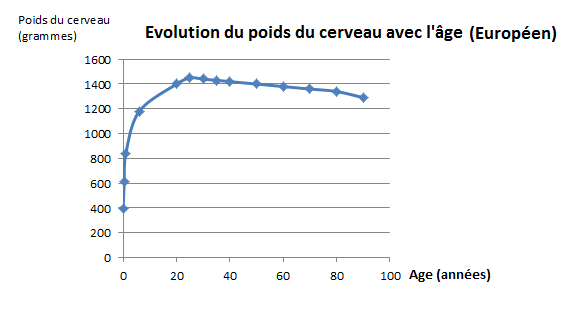
Evolution of brain weight and intelligence with age (below)
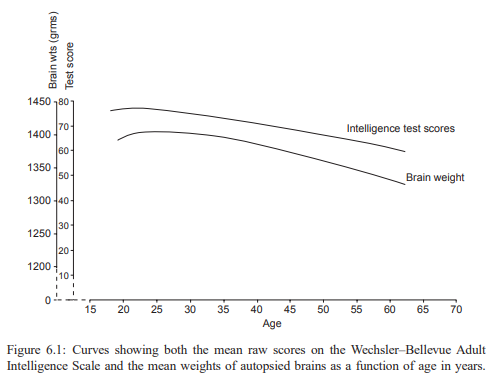
Intelligence increases throughout childhood and adolescence, peaking around 25.
After that, it begins a slow, gradual decline, which becomes more noticeable in later life.
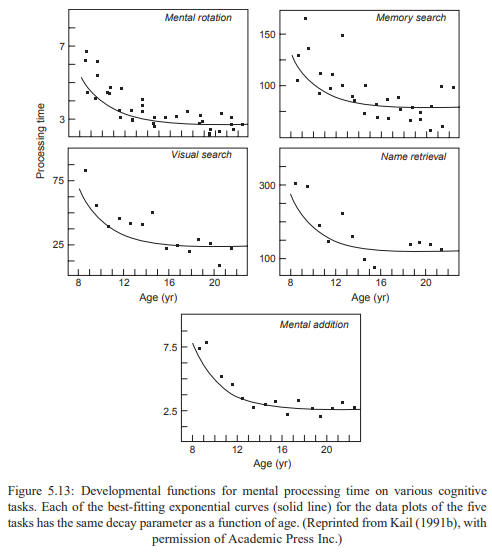
Even the most basic cognitive processes—such as simple reaction time or inspection time—follow a similar trajectory.
These functions reflect the physiological efficiency of the brain, which also peaks around 25.
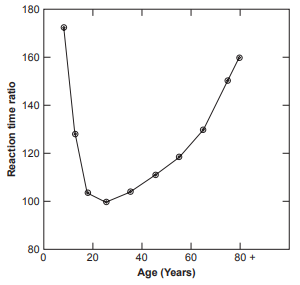
Reaction Time at Different Ages
The speed at which the brain processes information increases steadily with age, peaking around 25 years (see graphs below).
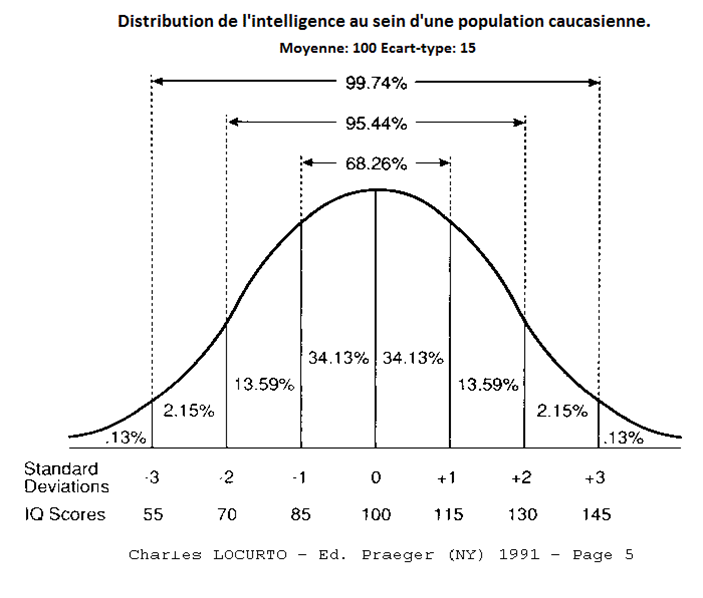
IQ follows a bell-shaped distribution, also known as a Gaussian or normal curve.
Most individuals cluster near the average of 100 (which corresponds to the mean intelligence of the European population), while fewer and fewer are found as we move away from the mean in either direction.
A useful comparison is human height:
Many adult men are around 1.75 meters tall, while very few are much shorter or taller than 1.95 meters. The same statistical principle applies to intelligence.
This distribution allows us to estimate precisely the proportion of individuals who exceed (or fall below) a given IQ level.
For instance, only about 2 percent of the European population has an IQ above 130.
IQ remains remarkably stable throughout life.
Longitudinal studies show that the correlation between IQ measured at age 11 and the same individual’s IQ at age 80 is approximately 0.72—a strong and significant relationship (Deary, 2004; Hailer, 2016).
This stability demonstrates that general intelligence (g) is a long-term trait, not merely a temporary performance measure or a product of short-term factors.
What does IQ mean?
| IQ / g Factor | Potential Activities | Intelligence Level | % of European Population (≥ IQ) | Average Cranial Capacity |
|---|---|---|---|---|
| 200 | Polymaths (e.g. Pascal, Galton, Newton, Marilyn vos Savant) | Highest measured intelligence in humans | Extremely rare | – |
| 175 | Great philosophers or writers (Cox, 1926) | – | 1 in 4 million | – |
| 165 | Estimated average of great composers (Cox, 1926) | – | – | – |
| 158 | Measured average IQ of Nobel Prize winners in science | – | 1 in 31,000 | 1640 cc |
| 145 | – | Highly Gifted | 0.14% | – |
| 135 | – | – | 1% | – |
| 130 | Physicists, surgeons, civil engineers, university professors | Very Superior Intelligence (Mensa level) | 3% | 1494 cc |
| 125 | Average IQ of doctors and postdoctoral researchers | Intellectual precocity | 5% | – |
| 120 | Average IQ of pharmacists | – | 9% | – |
| 115 | Average science graduates | Superior Intelligence | 16% | 1432 cc |
| 110 | Average among university students | – | 25% | – |
| 105 | – | – | 37% | – |
| 100 | General European average | Normal Intelligence | 50% | 1369 cc |
| 95 | Car dispatchers, clerical roles | – | 63% | – |
| 90 | – | – | 75% | – |
| 85 | Learning difficulties, repeated academic failure, suited to manual work | Borderline Intellectual Functioning | 84% | 1307 cc |
| 80 | Difficulty maintaining stable employment | – | 91% | – |
| 75 | – | – | – | – |
| 70 | DSM-5 threshold for intellectual disability | Beginning of Intellectual Disability | 98% | 1244 cc |
| 50–70 | Slow learning, often in special education, limited creativity or curiosity | Mild Intellectual Disability | – | – |
| 35–50 | Incomplete language, no autonomy, limited school learning | Moderate Intellectual Disability | – | – |
| 20–35 | Almost no language, no autonomy | Severe Intellectual Disability | – | – |
| <20 | Requires constant care, nonverbal communication | Profound Intellectual Disability | – | – |
Corroborating Montesquieu’s thesis in The Theory of Climates, modern findings in scientific psychology and evolutionary biology support the view that many human behaviours and psychological traits—including intelligence—have a significant innate, genetic basis.
(See: “Intelligence Is Essentially Genetic,” “Cause of Racial Differences,” and “Evolution of Intellectual Differences.”)
Climate, particularly during major events such as the Ice Age, is believed to have played a crucial role in shaping population-level cognitive traits over evolutionary timescales.
General intelligence (g), accurately assessed through IQ, has proven to be one of the most reliable and predictive measures of both individual and group outcomes.
Its strong correlations with biological variables and its predictive power in education, occupation, and social behaviour make IQ an indispensable tool for understanding human potential.
Does Each Population Have Its Own Intelligence?
It can be helpful to broaden the concept of intelligence by considering adaptive intelligence.
Every species that exists on Earth today has, by definition, demonstrated the ability to adapt to its environment and survive through natural selection.
In that sense, every living organism—from bacteria to mammals—possesses some form of adaptive intelligence.
For example:
-
Bacteria can survive extreme temperature changes and reproduce rapidly.
-
Chameleons exhibit sophisticated camouflage.
-
Hedgehogs are protected by spines.
-
Cheetahs are adapted for exceptional speed.
All these traits reflect biological adaptations that enhance a species’ ability to survive and reproduce.
These forms of survival-related problem-solving can be referred to as adaptive intelligence, a broad, evolutionary concept.
However, this is not the type of intelligence measured by IQ tests.
IQ focuses on cognitive intelligence, which involves reasoning, abstraction, memory, language, and problem-solving—capacities linked to the brain’s neural architecture and performance.
Cognitive intelligence can be regarded as a subset of adaptive intelligence—specifically, the brain-based, measurable component.
It is this form of intelligence that is hierarchical: some species, and some individuals, clearly outperform others in tasks involving logic, language, memory, and reasoning.
To illustrate:
Do you consider a cat or a dog as intelligent as a human being?
Most people would say no—because they are referring to cognitive intelligence, not general adaptability.
If, however, you ask whether cats or dogs have the same adaptive intelligence as humans, the answer becomes more complex.
Both species continue to exist and thrive, suggesting a form of successful adaptation.
But when it comes to cognitive abilities, humans clearly surpass other species.
Cognitive Intelligence in Human Populations
This website focuses on cognitive intelligence—the kind that can be quantified and compared across individuals and populations, as illustrated in Figure 1.
Research in psychometrics and evolutionary psychology has found variations in average IQ scores among different human populations.
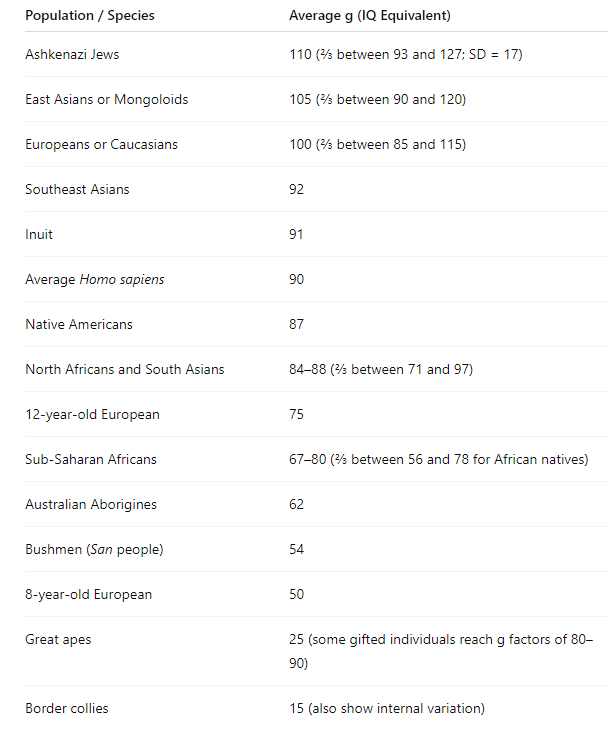
The data below are drawn from published meta-analyses and remain the subject of ongoing debate within the scientific community:
| Population Group | Estimated Average IQ |
|---|---|
| Ashkenazi Jews | 110 |
| East Asians | 105 |
| Europeans | 100 |
| Southeast Asians | 92 |
| Inuit | 91 |
| Caucasian-African mixed heritage | 81–90 |
| Native Americans | 86 |
| North Africans & South Asians | 84–88 |
| Sub-Saharan Africans | 71–80 |
| Australian Aborigines | 62 |
| Bushmen (San people) | 54 |
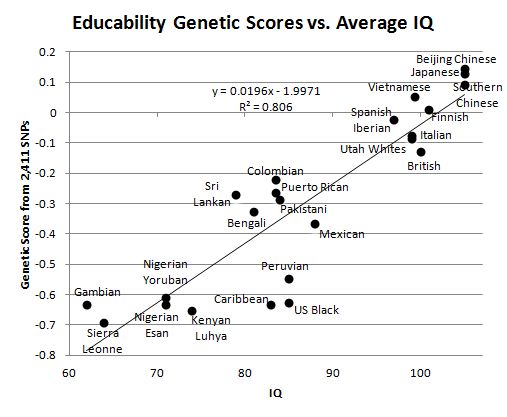
These differences have been interpreted by some researchers as partly genetic in origin, suggesting that climate and environmental pressures—particularly in colder regions—may have exerted stronger selective forces on problem-solving and abstract reasoning over evolutionary time.
Such hypotheses propose that:
-
Populations evolving in harsh, cold climates may have faced greater cognitive demands for planning, tool use, and long-term survival, leading to higher frequencies of alleles associated with intelligence.
-
These genetic variants could influence brain size, neural efficiency, and other neurophysiological processes underlying cognitive performance.
Each population also possesses unique cultural assets.
To illustrate, compare a computer to a human brain: the computer’s processing power is the electronic counterpart of biological intelligence—its “hardware.”
On this hardware, one can install different operating systems and programs—these represent culture, the acquired knowledge and learned behaviour that the brain assimilates from the outside world.
It is at the level of this central processor that the different human populations vary.
This variation is not merely a “cultural bias.”
For instance, studies report that Australian Aboriginal groups show lower average IQ scores, smaller average cranial capacity, and slower nerve-conduction velocity.
Conversely, East Asian populations tend to have higher average IQs, larger cranial capacity, faster nerve-conduction velocity, and higher frequencies of alleles associated with higher intelligence.
Yet, IQ retains equivalent predictive validity across populations: for individuals with the same IQ, average salaries or occupational outcomes are similar regardless of ancestry.
According to analyses such as The Bell Curve (Murray & Herrnstein, 1994) and The Global Bell Curve (Lynn, 2009), group-level disparities in social outcomes largely reflect differences in mean IQ, a pattern observed across multi-ethnic societies worldwide.
(See the summary “Intellectual Hierarchy Around the World.”)
| Computer | Brain | |
| Information processing | Hardware | Intelligence measured by g (central nervous system efficiency) |
| External acquisitions by: | Softwares | Various learning (speech, numbers, studies …) |
What is the impact of racial differences in intelligence on global geopolitics?
It is central and directly causal.
For example, about 75 percent of the differences in average wages per capita can be explained by differences in national mean IQ.
See the summary table “From Genes to Civilization.”
See also “IQ by Country and Economy.”
What Is the g Factor?
As seen previously, the factor g is essentially synonymous with IQ, but pedagogy relies on repetition—so it is worth revisiting what the g factor actually represents.
The factor g (g for general intelligence) is a biological, organic, person-to-person characteristic underlying all processes that pass through the central nervous system.
It was discovered by Charles Spearman, who observed that all mental processes are inter-correlated: someone who performs well in one area tends to perform well in others, while an individual with low cognitive ability generally scores poorly across all domains.
What astonished Spearman was that even the fineness of sound-frequency recognition—a test in which participants distinguish tones of differing frequency—produced the same hierarchy of results as classical IQ tests.
In other words, the precision of auditory discrimination correlated with the g factor: people with high g (high IQ) typically show finer auditory and visual resolution.
The g factor can thus be viewed as a measure of the power and complexity of the central nervous system.
The phenomenon of positive inter-correlations among mental abilities (called the “positive manifold”) has been described as “probably the most replicated finding in all of psychology” (Deary, 2000).
The g factor is measured in IQ units and is usually extracted from a conventional test battery.
What does “Indifference of Indicators” mean?
Consider the example of a computer.
Imagine ten different computers in front of you, whose processing power you do not yet know.
To estimate each processor’s speed, you could run various programs and observe which machines execute them more quickly.
This is precisely how one compares computer performance.
Almost any program will serve, because every program depends on the central processor.
After testing only a few programs, you can reasonably infer the relative processing speeds and establish an accurate ranking.
The same principle applies to the g factor, which underlies all processes passing through the central nervous system—cognitive, visual, auditory, and information-processing tasks alike.
Therefore, the specific type of test is not critical for identifying a person’s g factor, since all cognitive tests engage g to some degree.
Because all cognitive results are inter-correlated, only a few types of tests are needed to extract, through factor analysis, an individual’s g factor.
The g extracted from any test battery will always be virtually identical, within the limits of measurement error.
All kinds of tests, whatever their nature, contain some level of saturation in g.
As a result, a composite score derived from several tests will have increasingly high g saturation: the g components accumulate in the composite score, while the elements unrelated to g cancel each other out.
g factors extracted from different test batteries correlate between 0.95 and 1.0.
Essentially, it is the same underlying entity being measured—the common factor in all processes that pass through the central nervous system.
What are the average g in the animal world, including Homo sapiens?
To go further, Validity of IQ: Biological and Social IQ correlations.
Is IQ Hereditary?
Yes—essentially.
However, the term hereditary means influenced by genetic factors, not identical to one’s parents.
For example, you may have blue eyes even though both of your parents have brown eyes.
Intellectual variation—both among individuals and among population groups—is primarily of genetic origin.
It results from differences in the frequencies of alleles associated with higher or lower intelligence.
These alleles are being discovered gradually through advances in genetics.
For a more detailed discussion, see “Intelligence Is Highly Genetic.”
References (not exhaustive)
Deary, I. J. (2010). The neuroscience of human intelligence differences. Nature Reviews Neuroscience, 11(3), 201–211. https://doi.org/10.1038/nrn2793
Jensen, A. R. (1998). The g factor: The science of mental ability. Westport, CT: Praeger Publishers.
Jensen, A. R., Langan, C., & LoSasso, G. (2002). Discussion on genius and intelligence: Mega Foundation interview with Arthur Jensen. Mega Foundation. Retrieved from [Insert URL if available]
Larivée, S., Goulet, D., & Lavoie, L. (2009). Le quotient intellectuel, ses déterminants et son avenir. Montréal, Canada: Éditions Multimondes.
Lynn, R. (2015). Race differences in intelligence: An evolutionary analysis (2nd ed.). Augusta, GA: Washington Summit Publishers. (Original work published 2006)
Wikipedia (2018). g factor.